Fig. 17
Download original image
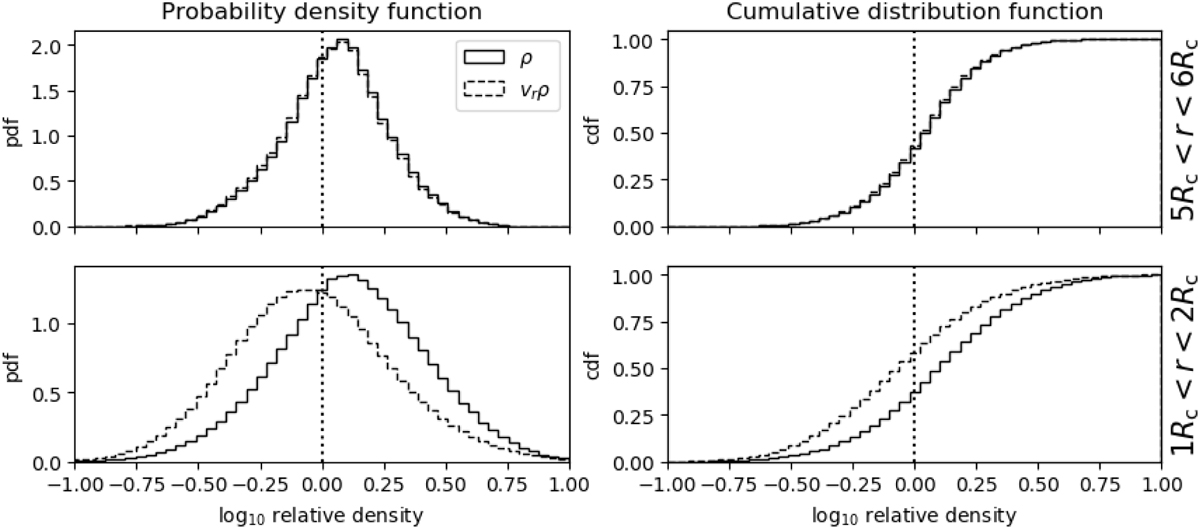
Distributions of mass (solid lines) and radial momentum (dotted lines) in our Γ3 model as a function of relative density. The two panels on the left show the probability density function, and the two panels on the right show the cumulative distribution function. The probability density and cumulative distribution functions calculated for the regions in the wind between 5 Rc and 6 Rc, and between 1 Rc and 2 Rc, are shown in the top and bottom panels, respectively. The probability density functions are normalized such that the integral over the variable shown on the x-axis gives unity.
Current usage metrics show cumulative count of Article Views (full-text article views including HTML views, PDF and ePub downloads, according to the available data) and Abstracts Views on Vision4Press platform.
Data correspond to usage on the plateform after 2015. The current usage metrics is available 48-96 hours after online publication and is updated daily on week days.
Initial download of the metrics may take a while.