Fig. 15
Download original image
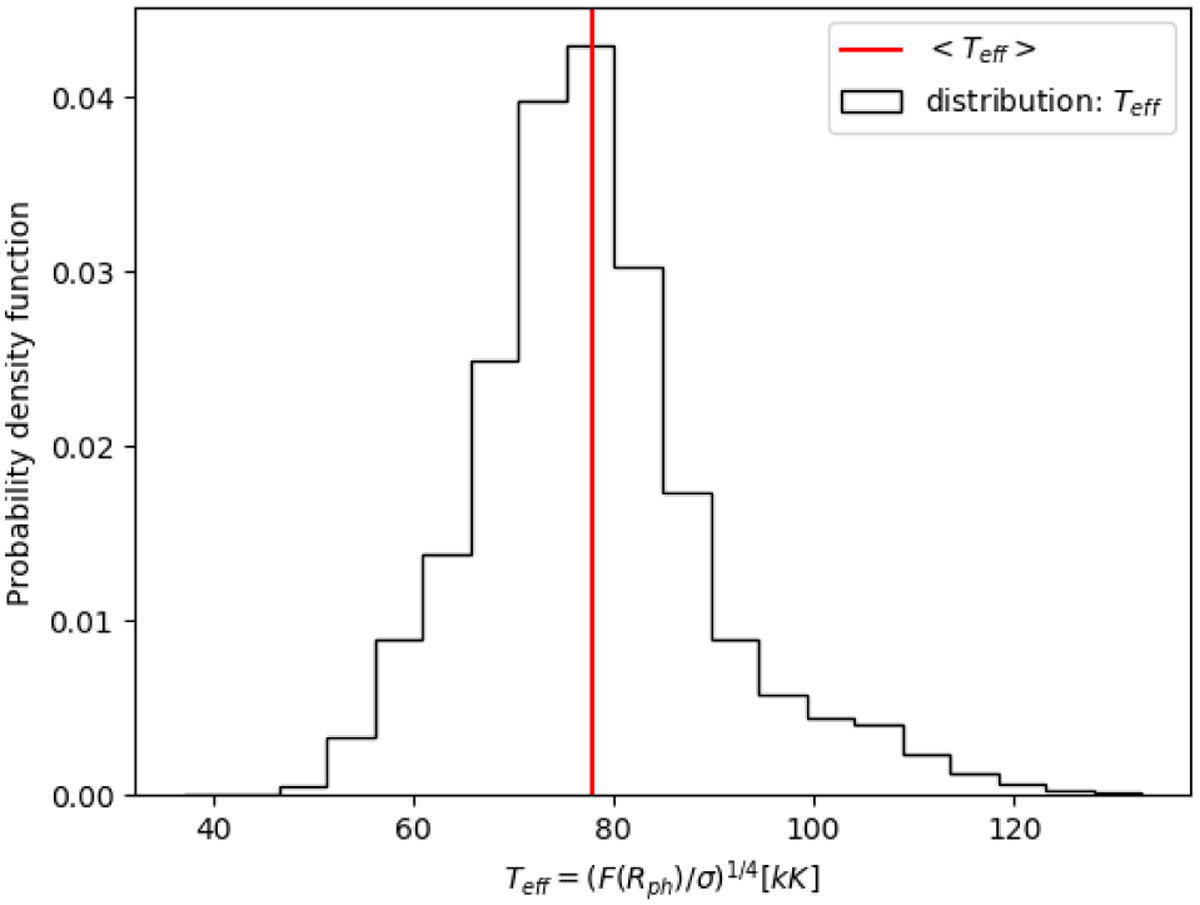
Probability density function of the effective photospheric temperature for the Γ3 model. The horizontal axis shows the effective temperature for a particular radial line of sight. Due to the time-dependent and laterally structured wind, this varies for different radial lines of sight, giving a distribution in r. This distribution is computed based on 128 × 128 transverse cells and on 10 time snapshots. The effective photospheric temperature is defined here as a function of the radiation flux calculated at the photospheric radius. The red line indicates the mean of the distribution. The probability density function is normalized such that the integral over the variable shown on the x-axis gives unity.
Current usage metrics show cumulative count of Article Views (full-text article views including HTML views, PDF and ePub downloads, according to the available data) and Abstracts Views on Vision4Press platform.
Data correspond to usage on the plateform after 2015. The current usage metrics is available 48-96 hours after online publication and is updated daily on week days.
Initial download of the metrics may take a while.