Fig. 11
Download original image
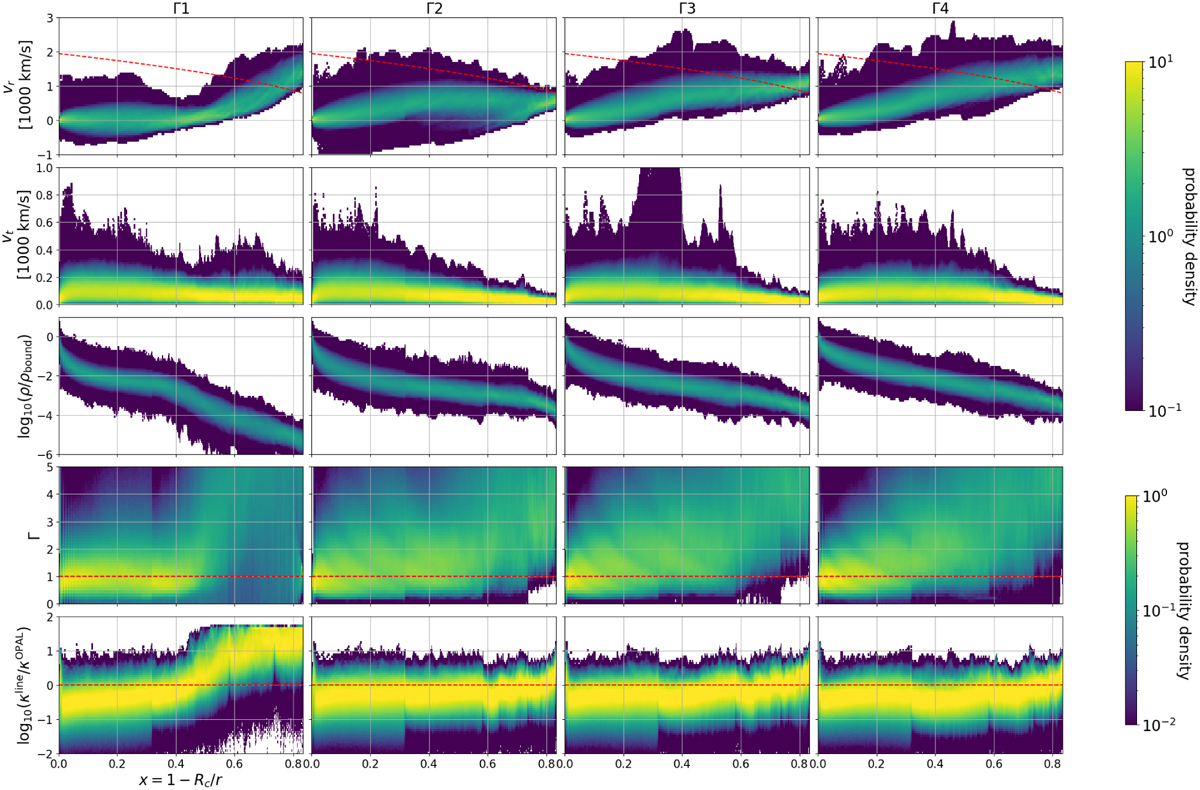
Probability densities for different quantities. Lateral slices from ten snapshots are used to calculate a probability distribution function at each radial point. The ten snapshots are taken after the numerical relaxation of the initial conditions and are all 1τdyn apart. Different columns represent models with different boundary luminosities, increasing the luminosity from left to right. The different rows represent, from top to bottom: the density-weighted radial velocity, the magnitude of the tangential velocity ![]() , the gas density, the effective Eddington parameter, and the ratio of κline over κOPAL. The color maps in the top three rows are scaled differently to those of the bottom two rows for visibility reasons. This is because the probability distribution functions of the top three quantities are typically thinner and higher peaked. The probability density functions are normalized such that the integral over the variable shown on the y-axis gives unity at each radius.
, the gas density, the effective Eddington parameter, and the ratio of κline over κOPAL. The color maps in the top three rows are scaled differently to those of the bottom two rows for visibility reasons. This is because the probability distribution functions of the top three quantities are typically thinner and higher peaked. The probability density functions are normalized such that the integral over the variable shown on the y-axis gives unity at each radius.
Current usage metrics show cumulative count of Article Views (full-text article views including HTML views, PDF and ePub downloads, according to the available data) and Abstracts Views on Vision4Press platform.
Data correspond to usage on the plateform after 2015. The current usage metrics is available 48-96 hours after online publication and is updated daily on week days.
Initial download of the metrics may take a while.