Fig. 10
Download original image
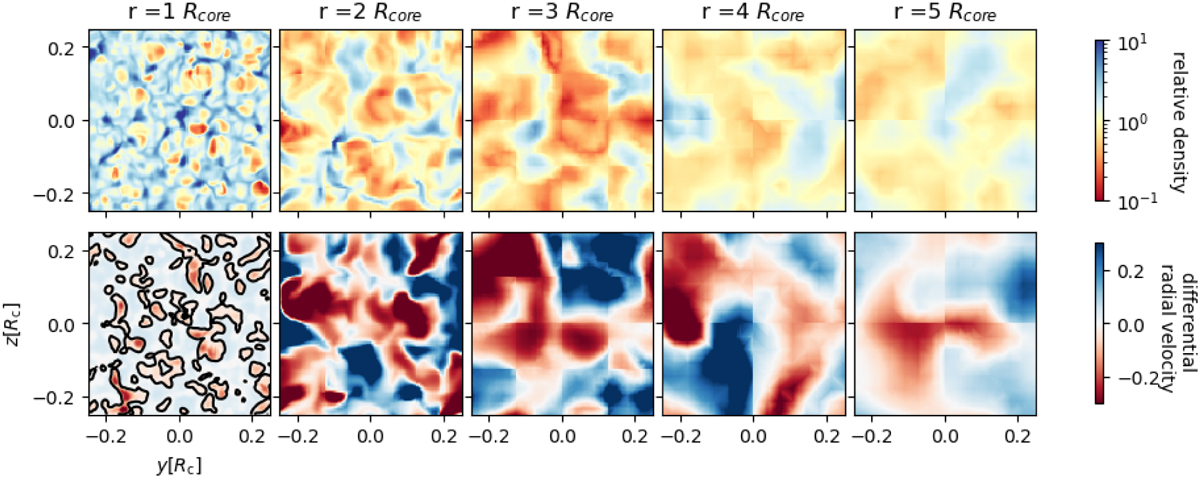
Relative density and radial velocity for a representative snapshot of the Γ3 3D simulation. In the top row, overdensities are indicated in blue and underdensities are indicated in red. In the bottom row, gas moving faster than average is indicated in blue, and gas moving slower than average is indicated in red. Different columns represent different radial coordinates, with the first column representing a radius just above the core radius. In the bottom row, the black contour represents the region where the absolute radial velocity is equal to zero.
Current usage metrics show cumulative count of Article Views (full-text article views including HTML views, PDF and ePub downloads, according to the available data) and Abstracts Views on Vision4Press platform.
Data correspond to usage on the plateform after 2015. The current usage metrics is available 48-96 hours after online publication and is updated daily on week days.
Initial download of the metrics may take a while.