Fig. 7
Download original image
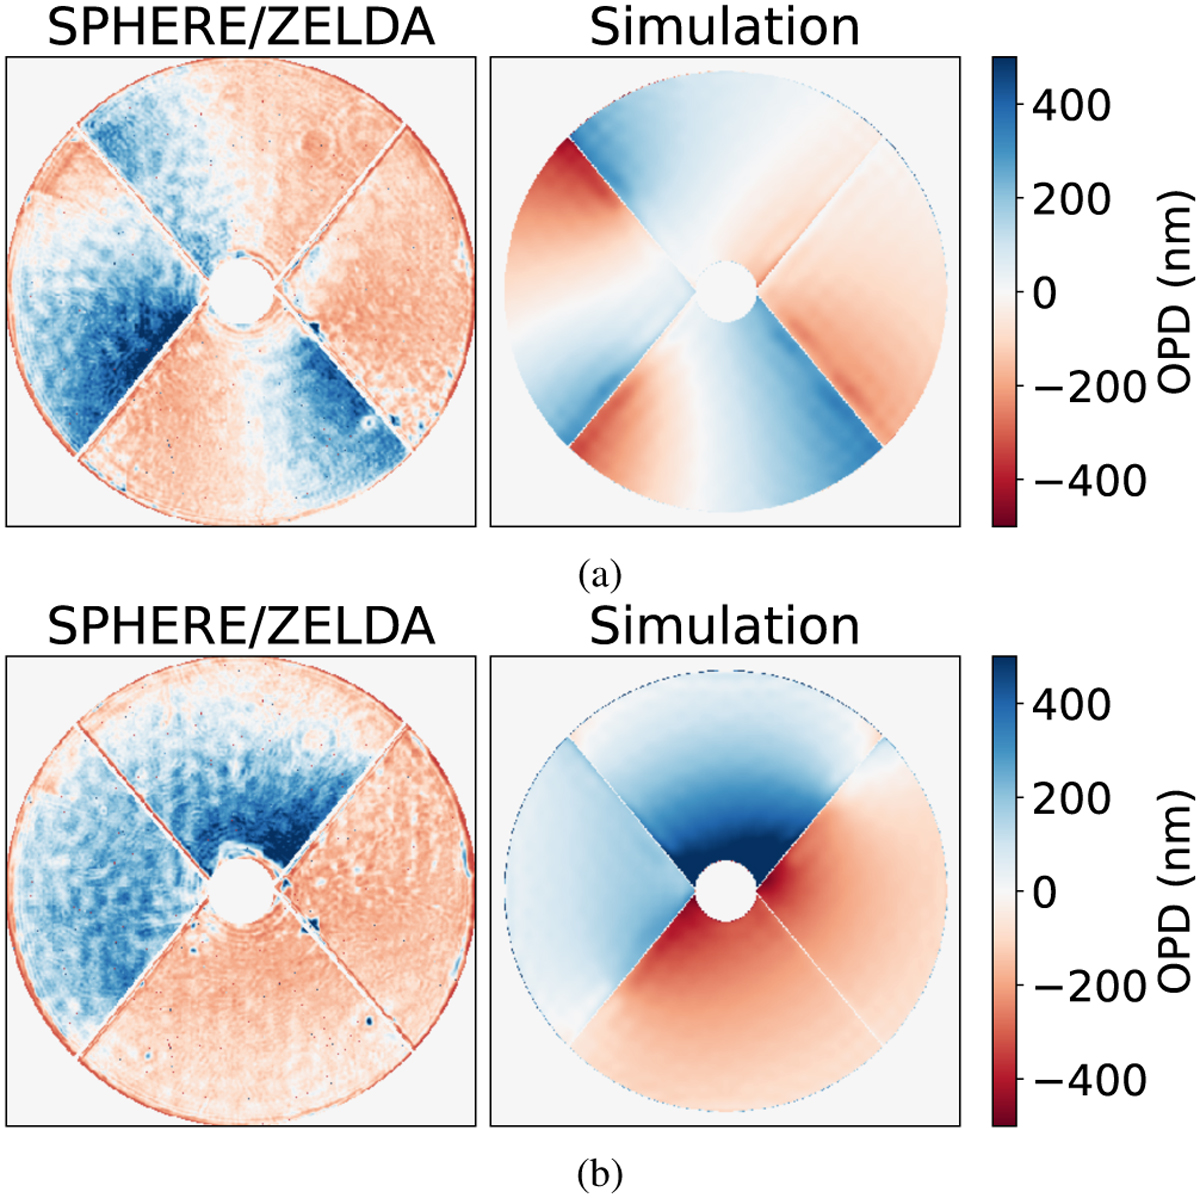
Qualitative comparison between ZELDA measurements (left) and simulated post-AO residuals (right) for two LWE events (a) and (b). The ZELDA measurements have a 1 second detector integration time. They were taken during the night of 2014 October 8. The simulations match the typical SPHERE configuration. The result after convergence of the loop is shown here.
Current usage metrics show cumulative count of Article Views (full-text article views including HTML views, PDF and ePub downloads, according to the available data) and Abstracts Views on Vision4Press platform.
Data correspond to usage on the plateform after 2015. The current usage metrics is available 48-96 hours after online publication and is updated daily on week days.
Initial download of the metrics may take a while.