Fig. 4
Download original image
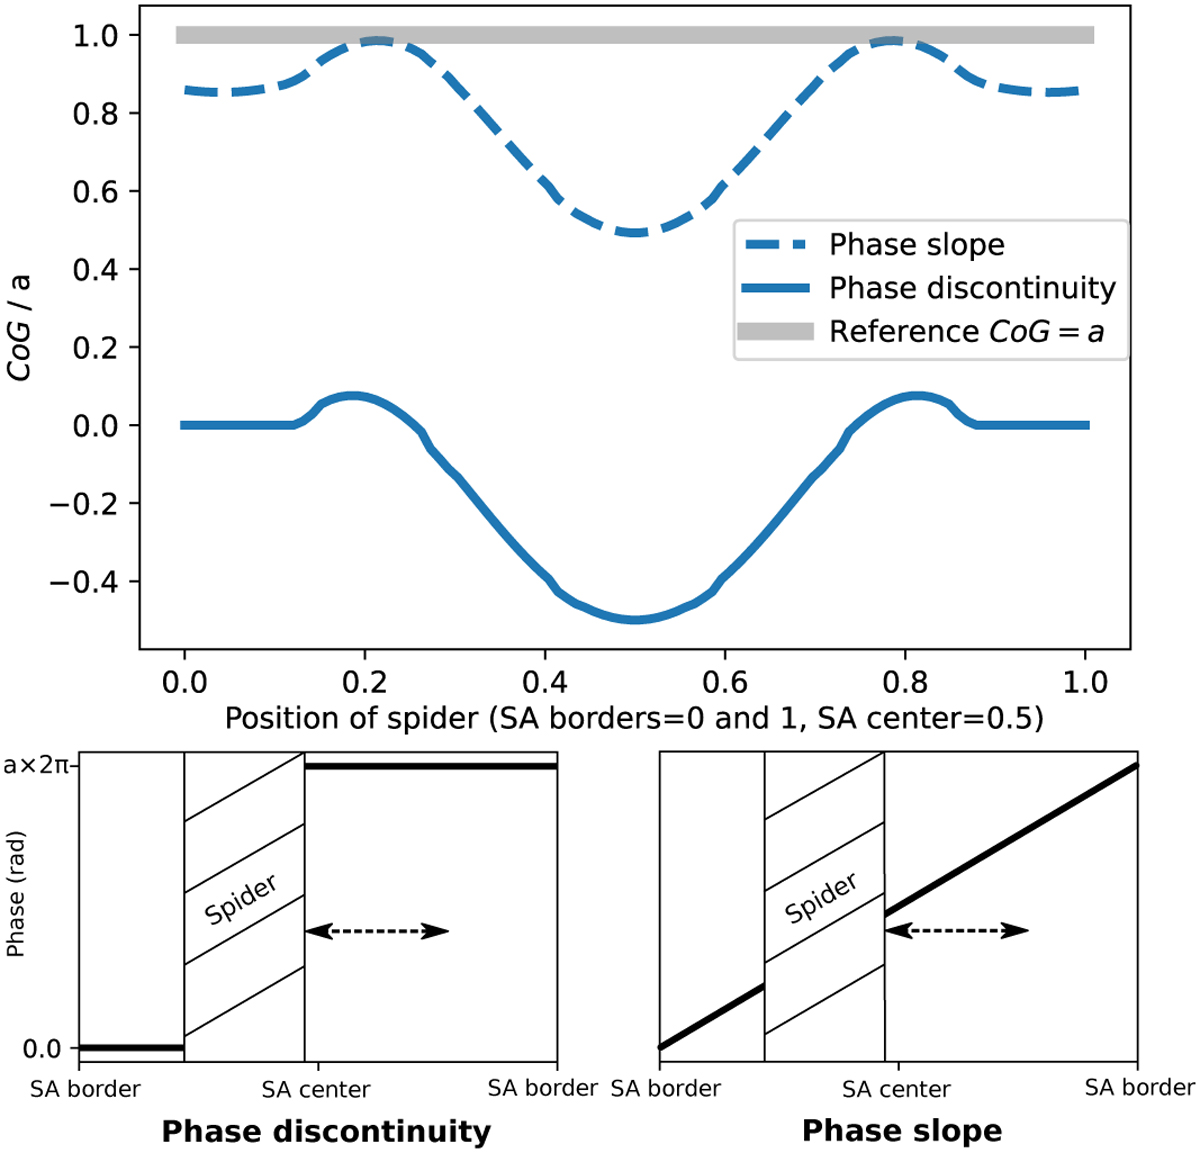
Impact of the spider position on the CoG measurement. Top: sensitivity to a phase discontinuity and a phase slope with respect to the position of the spider in the subaperture (SA). The spider thickness is 25% of the SA width and the field of view is 3.5 λ/d. The simulation is carried out for a = 0.05 (weak phase regime). Bottom: 1D illustration of the free parameter, the position of the spider, in both the phase discontinuity (left) and the phase slope (right) cases.
Current usage metrics show cumulative count of Article Views (full-text article views including HTML views, PDF and ePub downloads, according to the available data) and Abstracts Views on Vision4Press platform.
Data correspond to usage on the plateform after 2015. The current usage metrics is available 48-96 hours after online publication and is updated daily on week days.
Initial download of the metrics may take a while.