Open Access
Fig. 6.
Download original image
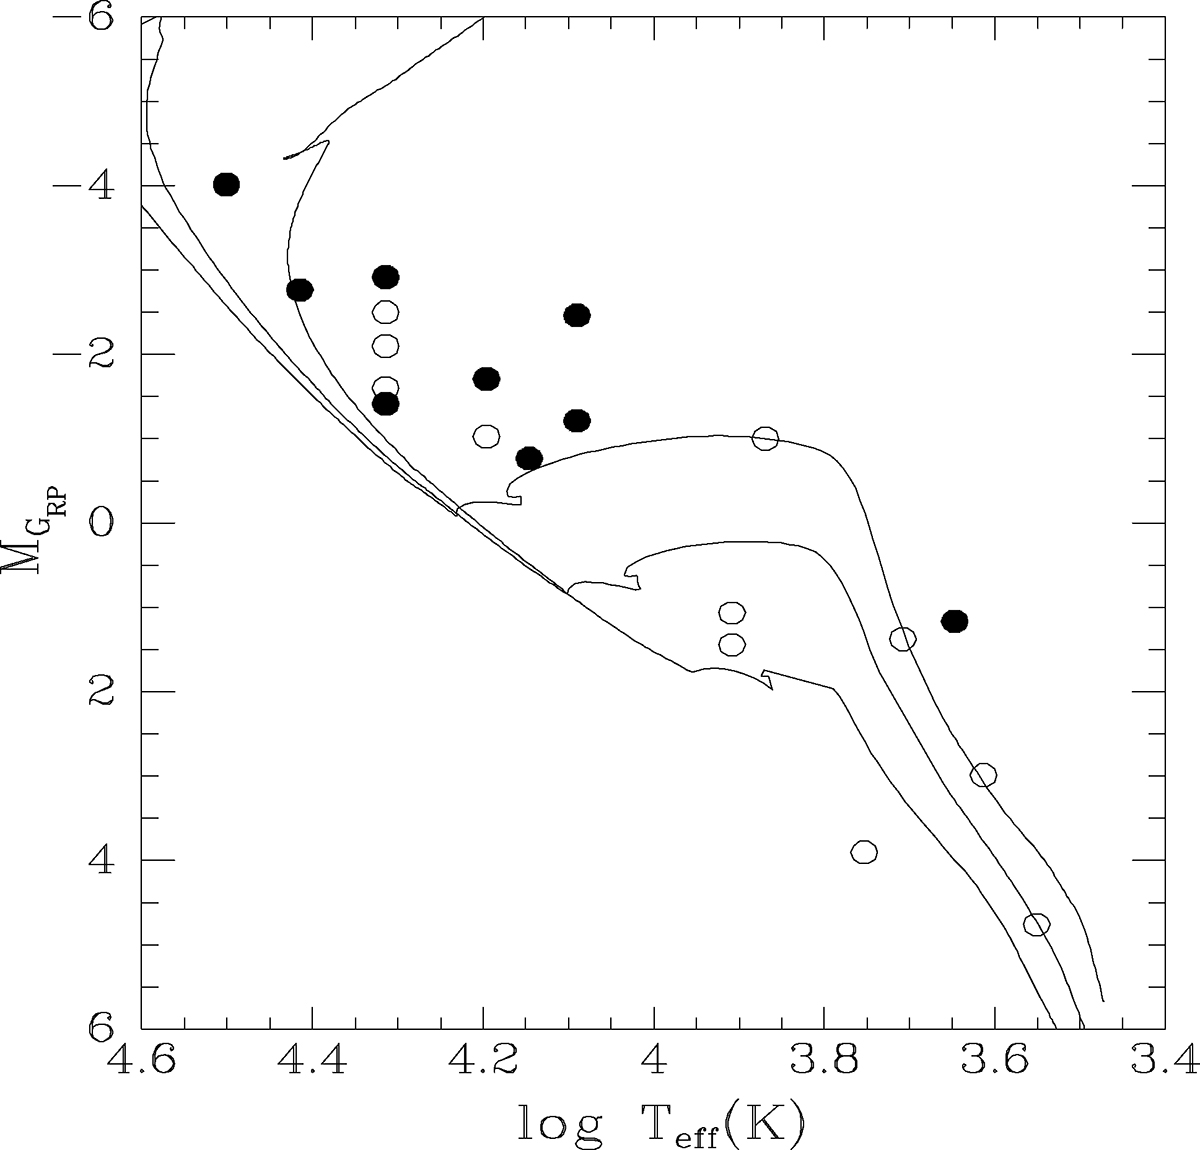
Temperature-magnitude diagram of all the stars in Table 3 (with the exception of J183127.81−020521.8, whose spectra type is poorly determined and no GBP and GRP photometry is available). The MESA isochrones for 1, 3, and 10 Myr are plotted as well. Full circles represent cluster members.
Current usage metrics show cumulative count of Article Views (full-text article views including HTML views, PDF and ePub downloads, according to the available data) and Abstracts Views on Vision4Press platform.
Data correspond to usage on the plateform after 2015. The current usage metrics is available 48-96 hours after online publication and is updated daily on week days.
Initial download of the metrics may take a while.