Open Access
Fig. 1.
Download original image
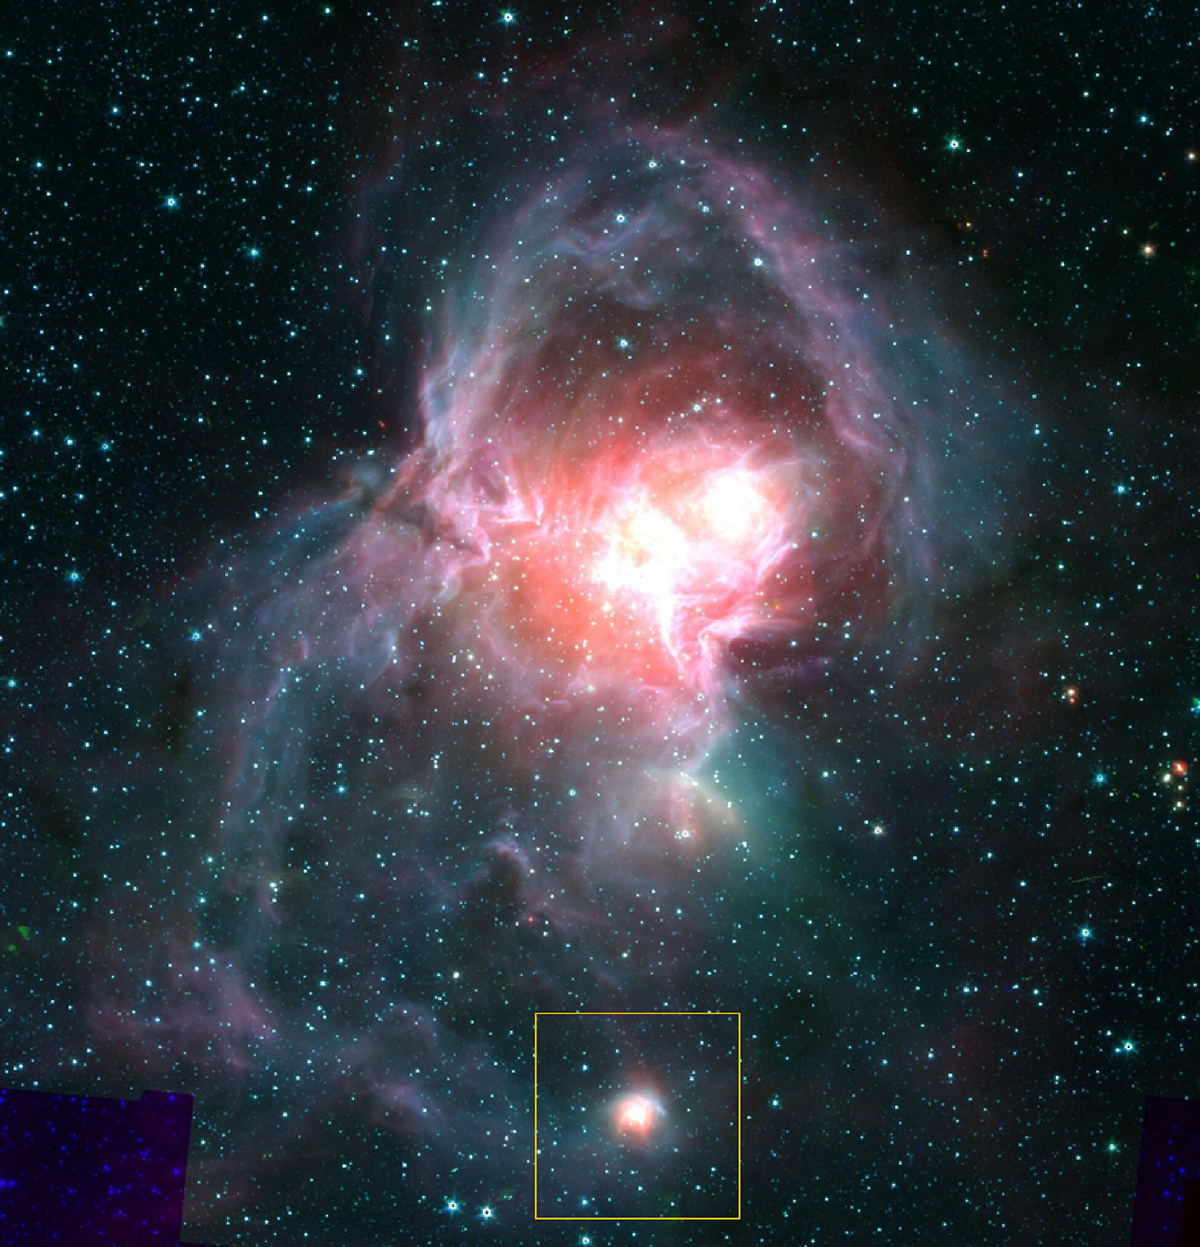
Panoramic view of W40 obtained by the Spitzer Space Observatory. The blue, green, and red channels correspond to emission in the 3.6, 4.5, and 24 μm bands. The field covered is 34′ across. The yellow rectangle indicates the area displayed in more detail in Fig. 8.
Current usage metrics show cumulative count of Article Views (full-text article views including HTML views, PDF and ePub downloads, according to the available data) and Abstracts Views on Vision4Press platform.
Data correspond to usage on the plateform after 2015. The current usage metrics is available 48-96 hours after online publication and is updated daily on week days.
Initial download of the metrics may take a while.