Open Access
Fig. 9.
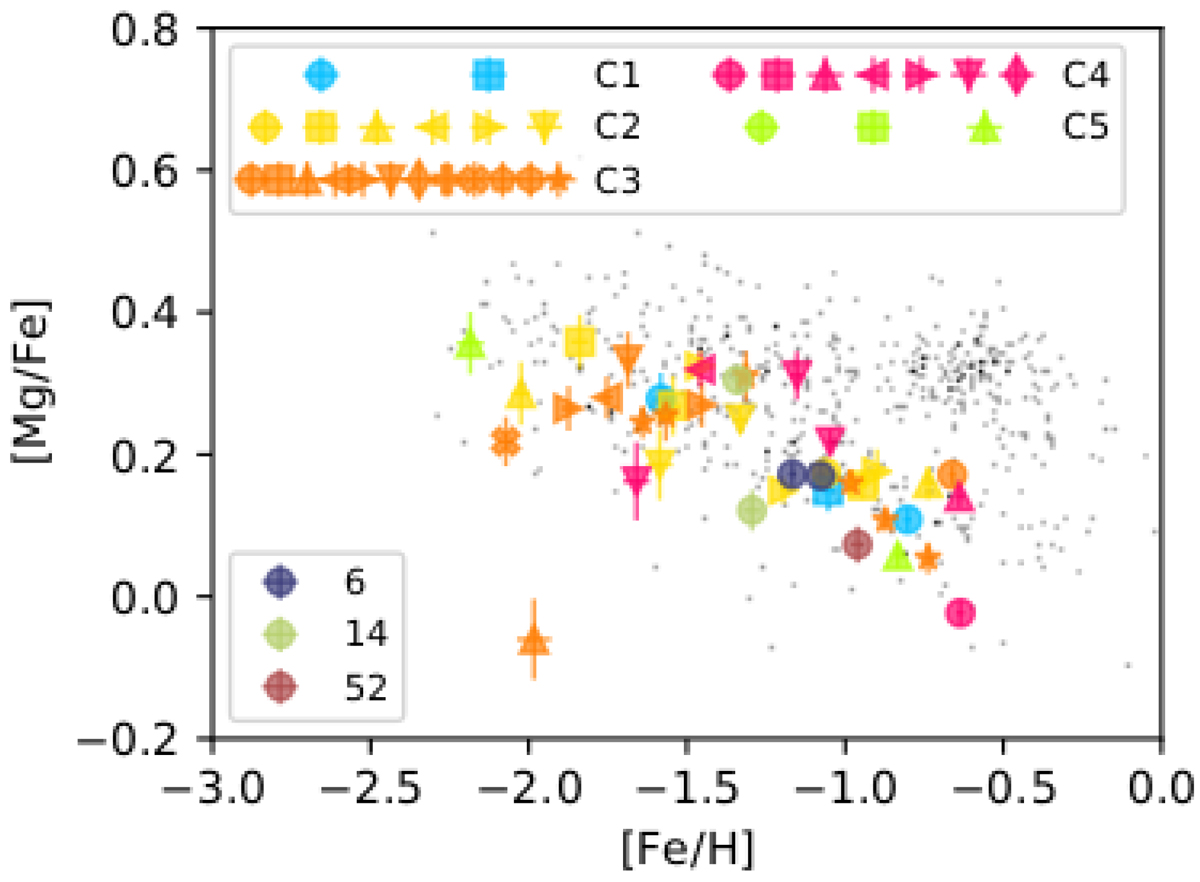
Download original image
[Mg/Fe] abundance ratios as a function of [Fe/H] for substructure C (GE) from APOGEE DR16. We use different symbols for the different clusters. Colours for the groups (C1 to C5) follow Fig. 8. The small dots show abundances of all the halo stars within 2.5 kpc in APOGEE DR16.
Current usage metrics show cumulative count of Article Views (full-text article views including HTML views, PDF and ePub downloads, according to the available data) and Abstracts Views on Vision4Press platform.
Data correspond to usage on the plateform after 2015. The current usage metrics is available 48-96 hours after online publication and is updated daily on week days.
Initial download of the metrics may take a while.