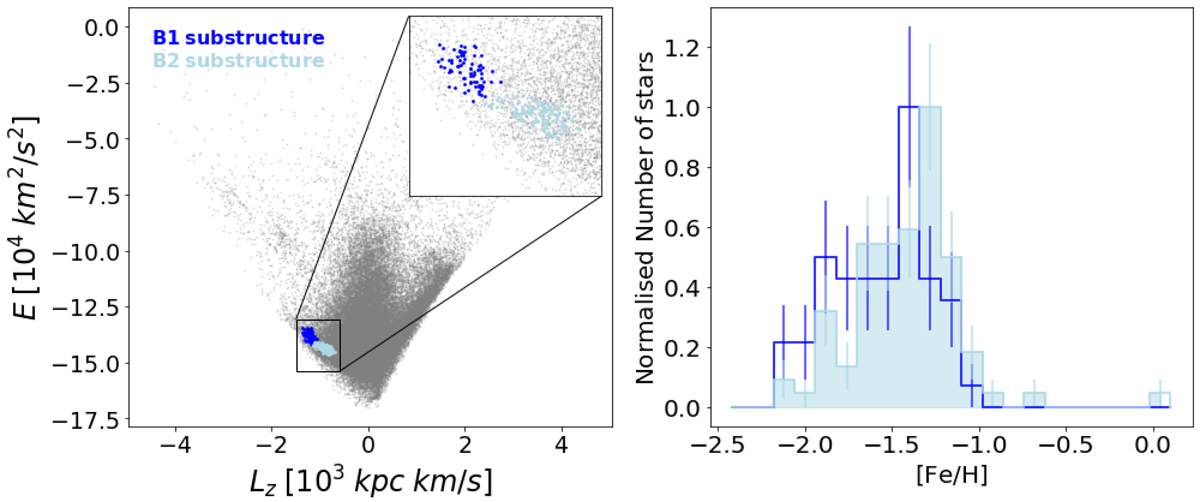
Fig. 7.
Download original image
Characterisation of the substructures identified within the tentative structure B. Left: distribution in the E − Lz plane. The original sample of halo stars is shown as a grey background. Right: normalised MDFs. We use blue for B1 (Thamnos 1) and cyan for B2 (Thamnos 2; see text for details). Error bars are computed assuming Poisson statistics.
Current usage metrics show cumulative count of Article Views (full-text article views including HTML views, PDF and ePub downloads, according to the available data) and Abstracts Views on Vision4Press platform.
Data correspond to usage on the plateform after 2015. The current usage metrics is available 48-96 hours after online publication and is updated daily on week days.
Initial download of the metrics may take a while.