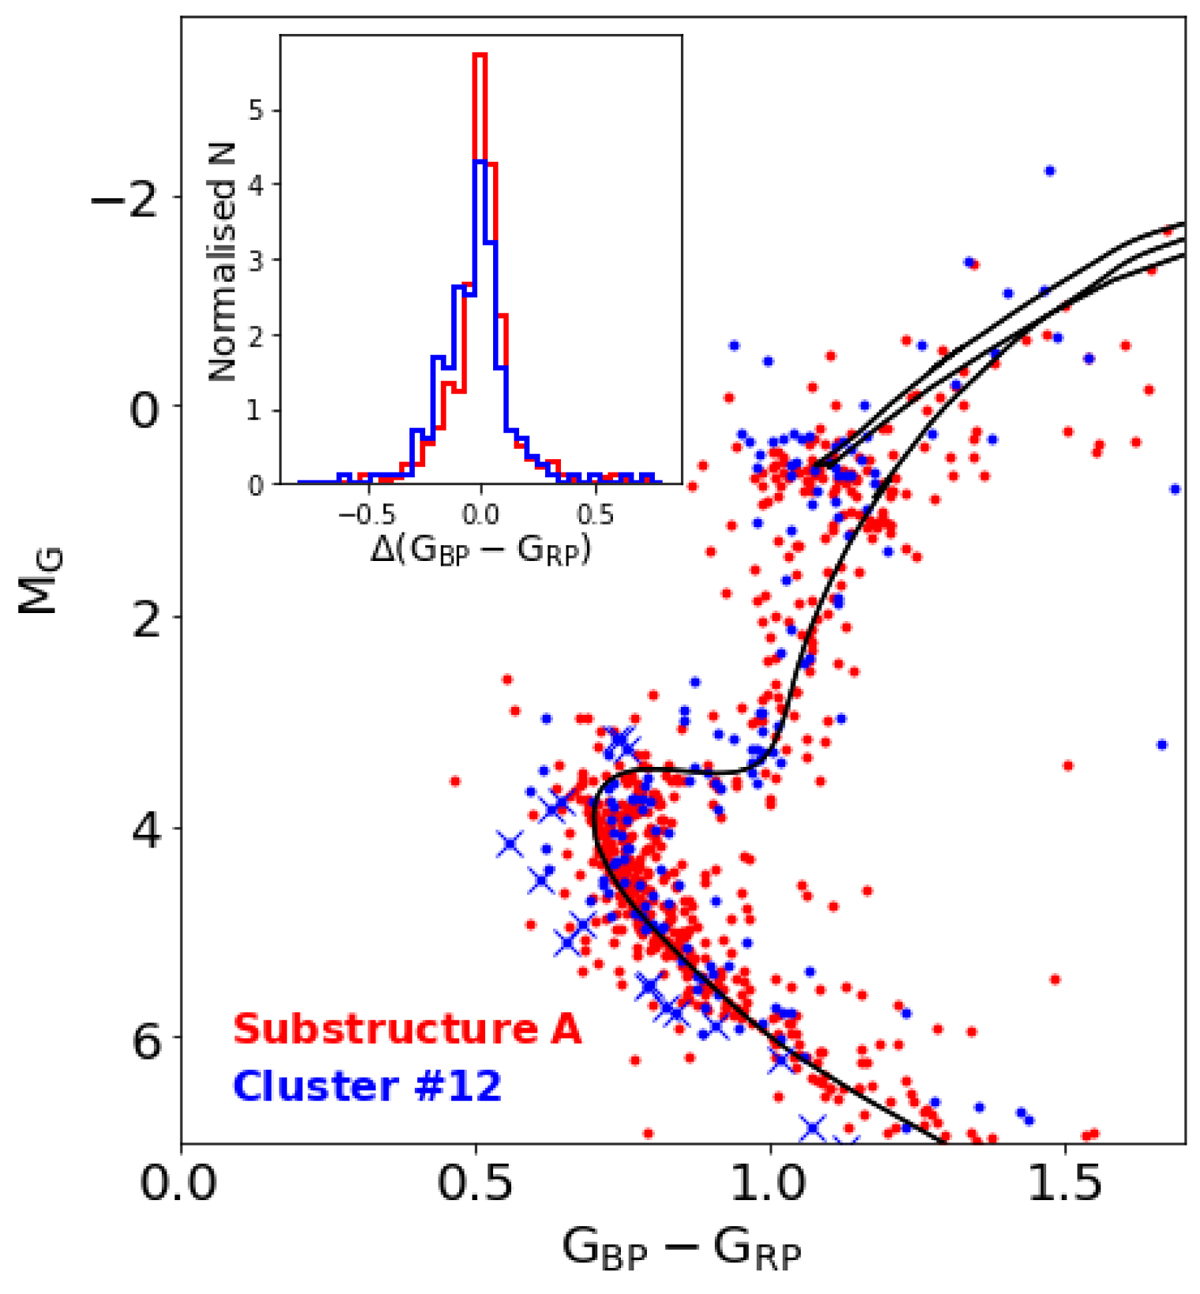
Fig. 6.
Download original image
Comparison of the distribution of stars in CaMD for cluster #12 (blue) and substructure A (red). The black line represent the isochrone that best reproduces the distribution of stars in the CaMD for substructure A (see Sect. 3.1). The inset panel shows the distributions of colours with respect to the best fit isochrone for both structures. We mark low-metallicity stars ([Fe/H] < −1.4) with blue crosses.
Current usage metrics show cumulative count of Article Views (full-text article views including HTML views, PDF and ePub downloads, according to the available data) and Abstracts Views on Vision4Press platform.
Data correspond to usage on the plateform after 2015. The current usage metrics is available 48-96 hours after online publication and is updated daily on week days.
Initial download of the metrics may take a while.