Fig. 5.
Download original image
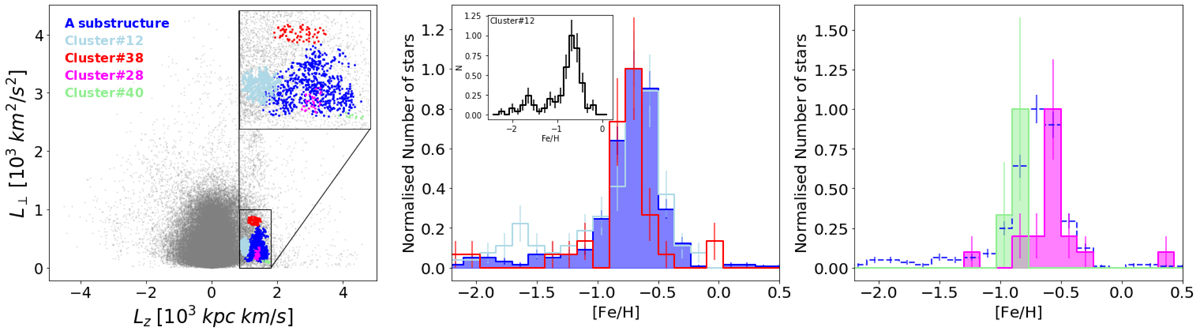
Characterisation of substructure A and the independent clusters #12, #38, #28, and #40. Left: distribution in the L⊥ − Lz plane. The original sample of halo stars is shown as a grey background. Middle: normalised MDFs for the three largest (in number of stars) structures/clusters. As an inset we add the MDF of cluster #12 alone to highlight its apparently double population. See text for details. Right: normalised MDFs for clusters #28 and #40, showing a narrow MDF. We add the MDF of substructure A (dashed, blue line) for comparison. Error bars in all plots are computed assuming Poisson statistics.
Current usage metrics show cumulative count of Article Views (full-text article views including HTML views, PDF and ePub downloads, according to the available data) and Abstracts Views on Vision4Press platform.
Data correspond to usage on the plateform after 2015. The current usage metrics is available 48-96 hours after online publication and is updated daily on week days.
Initial download of the metrics may take a while.