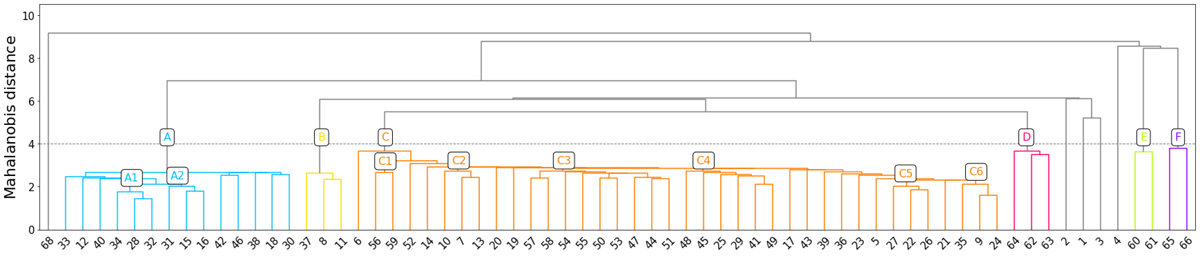
Fig. 1.
Download original image
Relationship between the significant clusters according to the single linkage algorithm, depicted according to their Mahalanobis distance in the IoM space (Paper I). The different colours represent a tentative classification into different substructures, namely six large groups (named A to F) and a set of individual clusters (in grey; see text for details). The order of the clusters along the x-axis is such that it facilitates the interpretation and readability of the dendrogram, and does not reflect internal properties. In our analyses (e.g. tables, etc.), we broadly follow this same order.
Current usage metrics show cumulative count of Article Views (full-text article views including HTML views, PDF and ePub downloads, according to the available data) and Abstracts Views on Vision4Press platform.
Data correspond to usage on the plateform after 2015. The current usage metrics is available 48-96 hours after online publication and is updated daily on week days.
Initial download of the metrics may take a while.