Fig. 3
Download original image
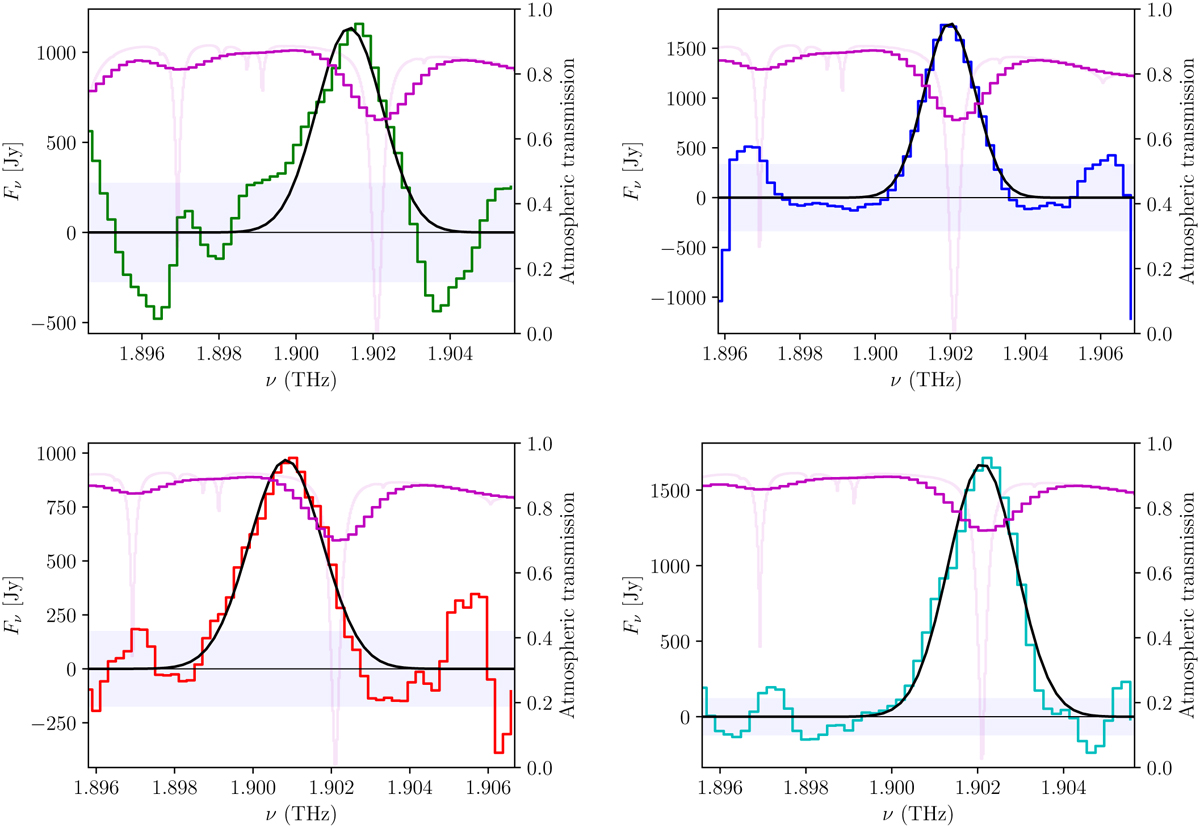
[C ii] emission line spectra of the four LOSs from the SOFIA FIFI-LS spectrometer. The continuum-subtracted fluxes are shown with the histograms. The color of each histogram corresponds to the LOS marked with the same colored star in Fig. 2. Light magenta corresponds to the transmission atmospheric model and the dark magenta histogram to the transmission model convolved with the instrumental spectral resolution. The solid black line corresponds to the Gaussian fit. The blue-shaded region shows the level of the continuum rms.
Current usage metrics show cumulative count of Article Views (full-text article views including HTML views, PDF and ePub downloads, according to the available data) and Abstracts Views on Vision4Press platform.
Data correspond to usage on the plateform after 2015. The current usage metrics is available 48-96 hours after online publication and is updated daily on week days.
Initial download of the metrics may take a while.