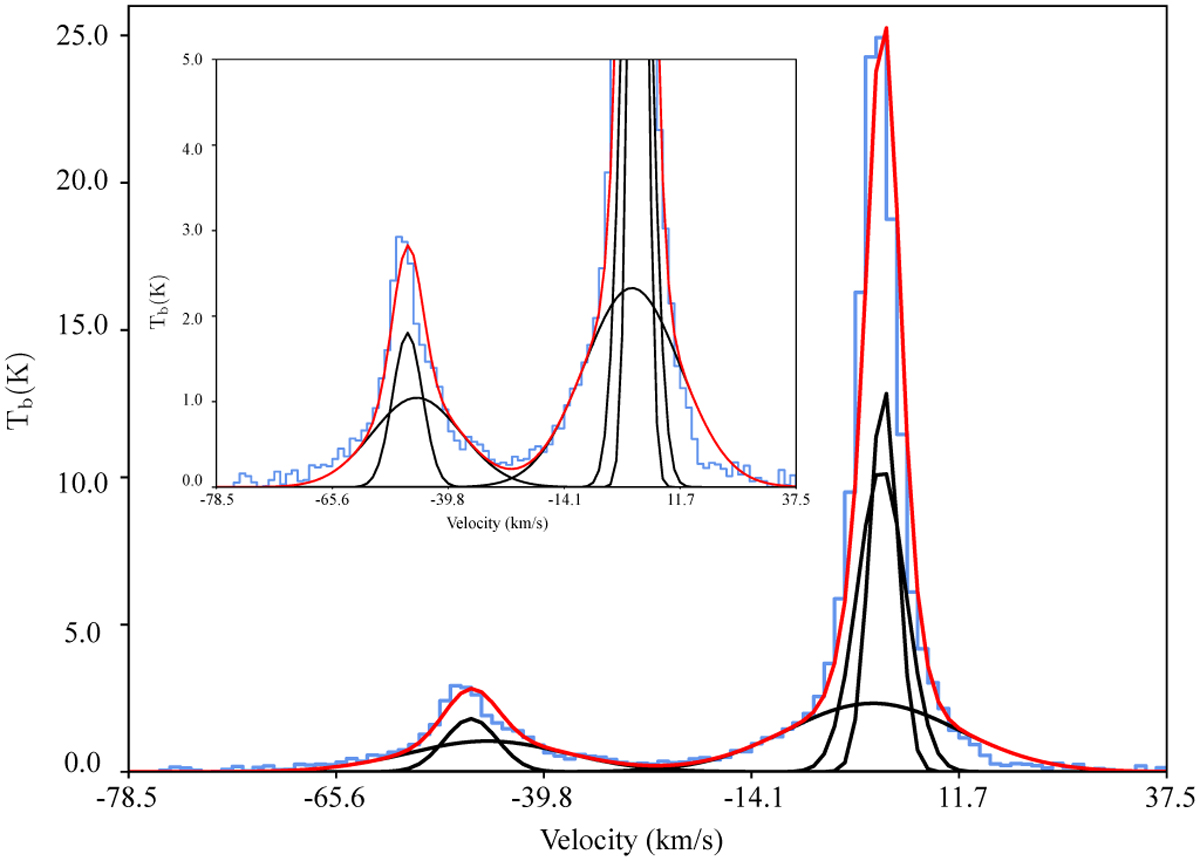
Fig. C.1
Download original image
Characteristic H i spectrum fitted by ROHSA. The vertical axis is intensity measured in antenna temperature units (K), and the horizontal axis is the gas velocity in km s−1. The blue histogram denotes the observed H i emission spectrum and the red line the corresponding fit produced by ROHSA. The black lines show the individual Gaussian components of the spectrum decomposition.
Current usage metrics show cumulative count of Article Views (full-text article views including HTML views, PDF and ePub downloads, according to the available data) and Abstracts Views on Vision4Press platform.
Data correspond to usage on the plateform after 2015. The current usage metrics is available 48-96 hours after online publication and is updated daily on week days.
Initial download of the metrics may take a while.