Fig. 2
Download original image
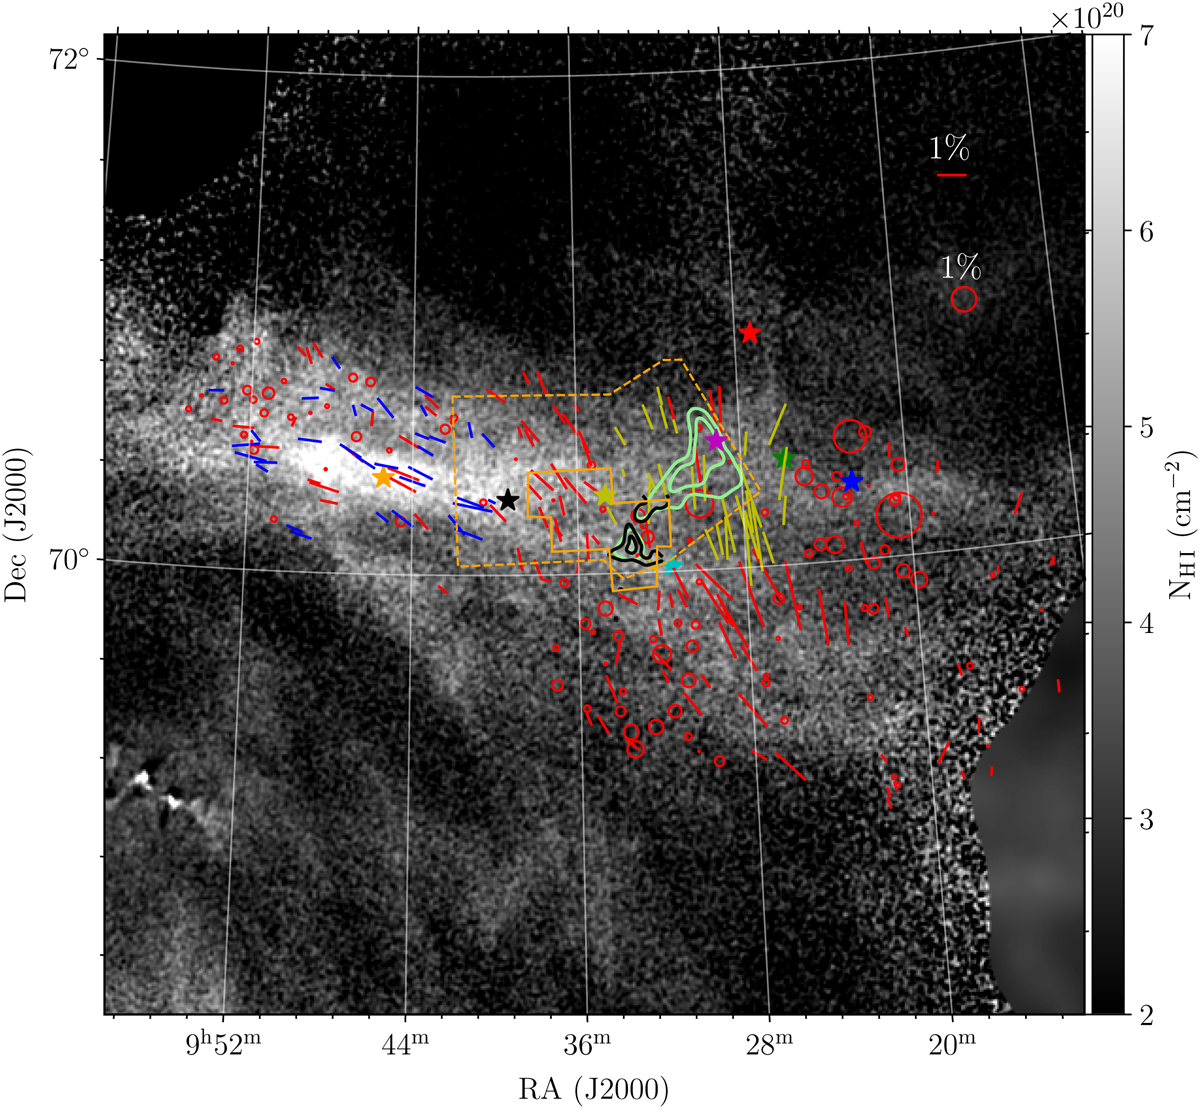
H i column density map of the target cloud. Colored segments correspond to the RoboPol polarization data with S/N ≥ 2.5 that trace the POS magnetic field. Blue and yellow segments correspond to measurements included in the estimation of the magnetic field strength in the atomic and molecular region, respectively. Red segments correspond to measurements with S/N ≥ 2.5 but were not used in the estimation of BPOS (Sect. 3.2). Measurements with S/N < 2.5 are shown with red circles. The radius of each circle corresponds to the observed polarization fraction. A scale segment and circle are shown in the top-right corner. Colored stars correspond to the C+ LOSs from both ISO (orange, black, and yellow) and SOFIA (green, blue, red, and cyan). The size of each star is much larger than the field of view of the instruments. Light green contours correspond to the CO (J = 1−0) integrated intensity at the 3, 5, and 9 K km s−1 levels. The black contours show the CO (J = 2−1) integrated intensity at the 2 and 4 K km s−1 levels. The dashed and solid orange polygons show the CO J = 1−0 and J = 2−1 surveyed regions, respectively.
Current usage metrics show cumulative count of Article Views (full-text article views including HTML views, PDF and ePub downloads, according to the available data) and Abstracts Views on Vision4Press platform.
Data correspond to usage on the plateform after 2015. The current usage metrics is available 48-96 hours after online publication and is updated daily on week days.
Initial download of the metrics may take a while.