Fig. 14
Download original image
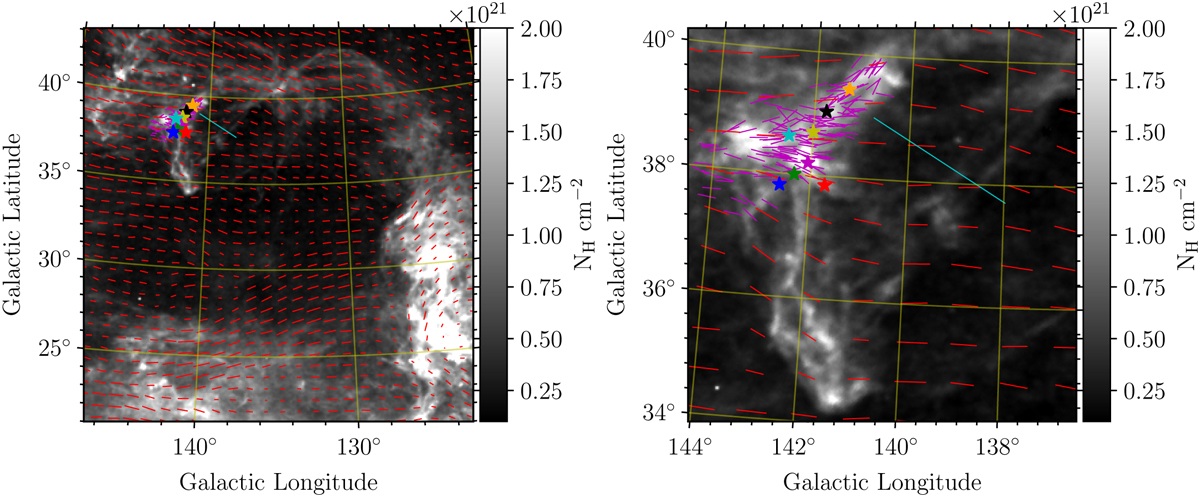
Magnetic field morphology overplotted on the Planck-based NH map of the NCPL. Left panel: dust emission polarization rotated by 90°, shown by red segments. The length of each segment is proportional to the polarized intensity. Magenta segments correspond to our polarization measurements; all segments have a fixed size for visualization purposes. There is an offset in the magnetic field orientation as traced by optical and submillimeter polarization due to the large beam difference between the two observables. Colored stars correspond to the target C+ LOSs, as shown in Fig. 2. Right panel: zoomed-in view of the region toward the target cloud. The solid cyan segment shows the Hα canal found by McCullough & Benjamin (2001).
Current usage metrics show cumulative count of Article Views (full-text article views including HTML views, PDF and ePub downloads, according to the available data) and Abstracts Views on Vision4Press platform.
Data correspond to usage on the plateform after 2015. The current usage metrics is available 48-96 hours after online publication and is updated daily on week days.
Initial download of the metrics may take a while.