Fig. 13
Download original image
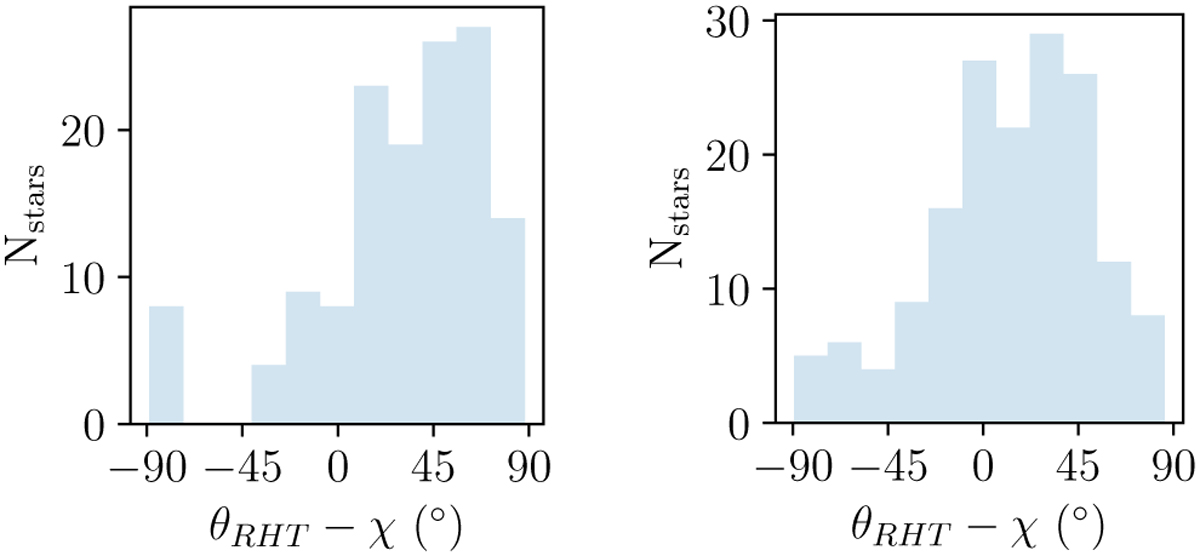
Distribution of relative orientations. Left panel: distribution of the difference between the orientation of the ![]() structure (θRHT) and the local polarization orientation (χ). The circular mean of this distribution is 43°. Right panel: same as in left panel, but for the difference between the orientation of the NH structure and the local polarization orientation. The circular mean of the distribution is 20°.
structure (θRHT) and the local polarization orientation (χ). The circular mean of this distribution is 43°. Right panel: same as in left panel, but for the difference between the orientation of the NH structure and the local polarization orientation. The circular mean of the distribution is 20°.
Current usage metrics show cumulative count of Article Views (full-text article views including HTML views, PDF and ePub downloads, according to the available data) and Abstracts Views on Vision4Press platform.
Data correspond to usage on the plateform after 2015. The current usage metrics is available 48-96 hours after online publication and is updated daily on week days.
Initial download of the metrics may take a while.