Fig. 1
Download original image
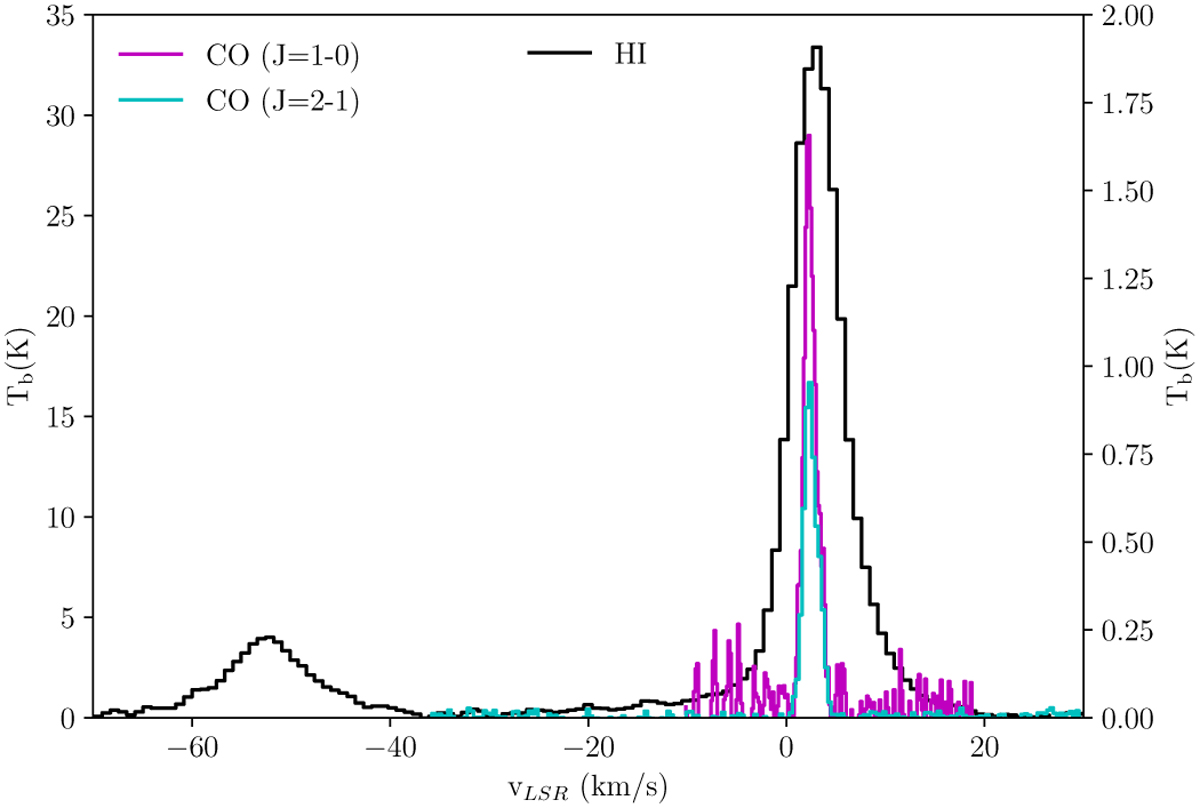
Brightness temperature versus gas velocity. The black histogram corresponds to the H i emission spectrum, magenta to 12CO (j = 1−0), and cyan to 12CO (J = 2−1). The antenna temperature of H i is shown on the left vertical axis and the CO lines on the right vertical axis. The size of each bin is equal to the spectral resolution of each spectrum, i.e., 0.82, 0.16, and 0.32 km s−1 for H i, CO (J = 1−0), and CO (J = 2−1) emission lines, respectively. These spectra were extracted from RA, Dec = 09:33:00, +70:09:00.
Current usage metrics show cumulative count of Article Views (full-text article views including HTML views, PDF and ePub downloads, according to the available data) and Abstracts Views on Vision4Press platform.
Data correspond to usage on the plateform after 2015. The current usage metrics is available 48-96 hours after online publication and is updated daily on week days.
Initial download of the metrics may take a while.