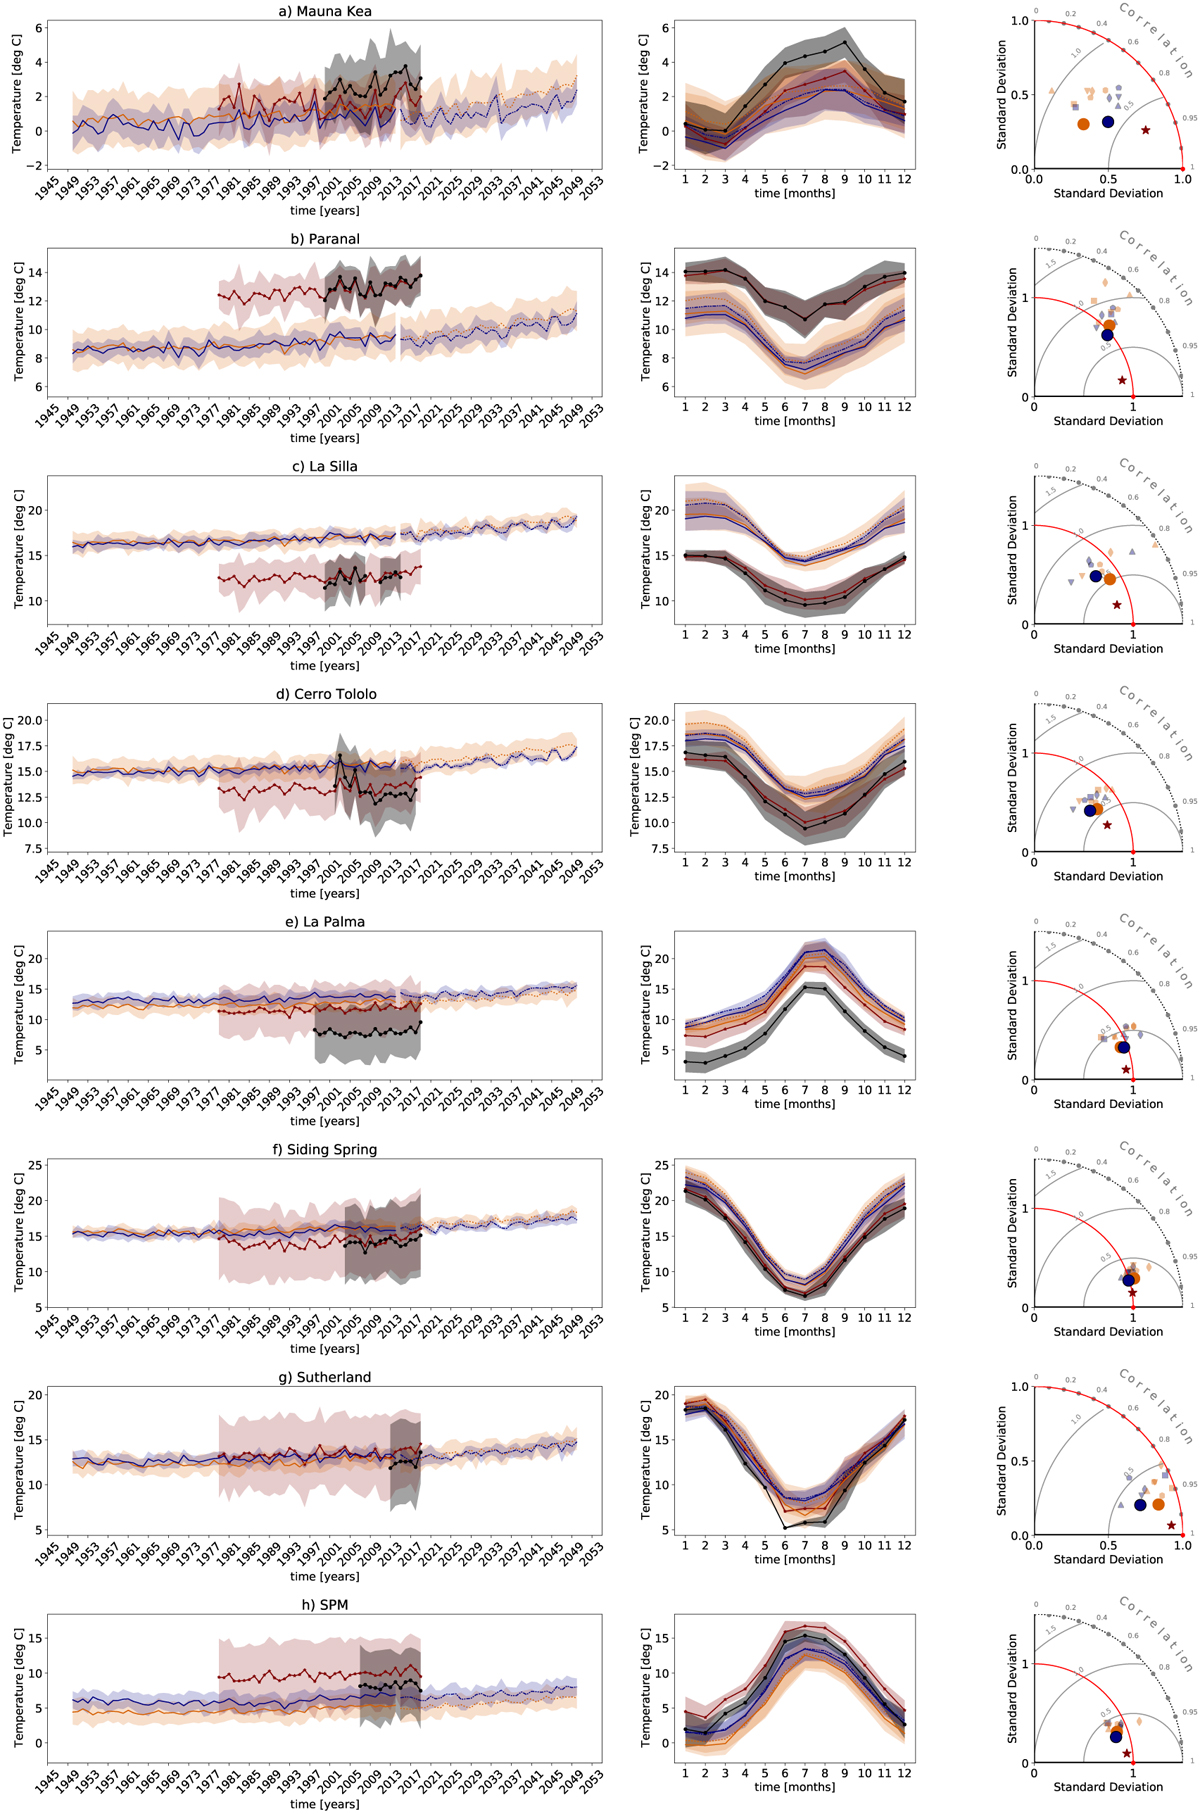
Fig. 4
Download original image
Time series (left column), seasonal cycle (middle column) and Taylor diagram (right column) for temperature (T). The shaded uncertainty regions are standard deviations. The time series, seasonal cycle and Taylor diagram contain in situ data (black filled circles in time series and seasonal cycle; red filled circle on x-axis of Taylor diagram), ERA5 data (maroon filled stars) and PRIMAVERA data for coupled-past (orange solid), coupled-future (orange dotted), atmos-past (blue solid) and atmos-future (blue dotted). In the Taylor diagram, apart from the ensemble mean (filled circles), we show the individual PRIMAVERA GCMs, namely HadGEM3-GC31-HM (pentagon), EC-Earth3P-HR (hexagon). CNRM-CM6-1-HR (square), MPI-ESM1 -2-XR (diamond), CMCC-CM2-VHR4 (up-triangle) and ECMWF-IFS-HR (down-triangle). The selected pressure levels are given in Table 4. The seasonal cycle and the Taylor diagram use monthly time-intersecting data (in situ measurements, ERA5 and historical PRIMAVERA). The future seasonal cycle is plotted for the time period 2015–2050.
Current usage metrics show cumulative count of Article Views (full-text article views including HTML views, PDF and ePub downloads, according to the available data) and Abstracts Views on Vision4Press platform.
Data correspond to usage on the plateform after 2015. The current usage metrics is available 48-96 hours after online publication and is updated daily on week days.
Initial download of the metrics may take a while.