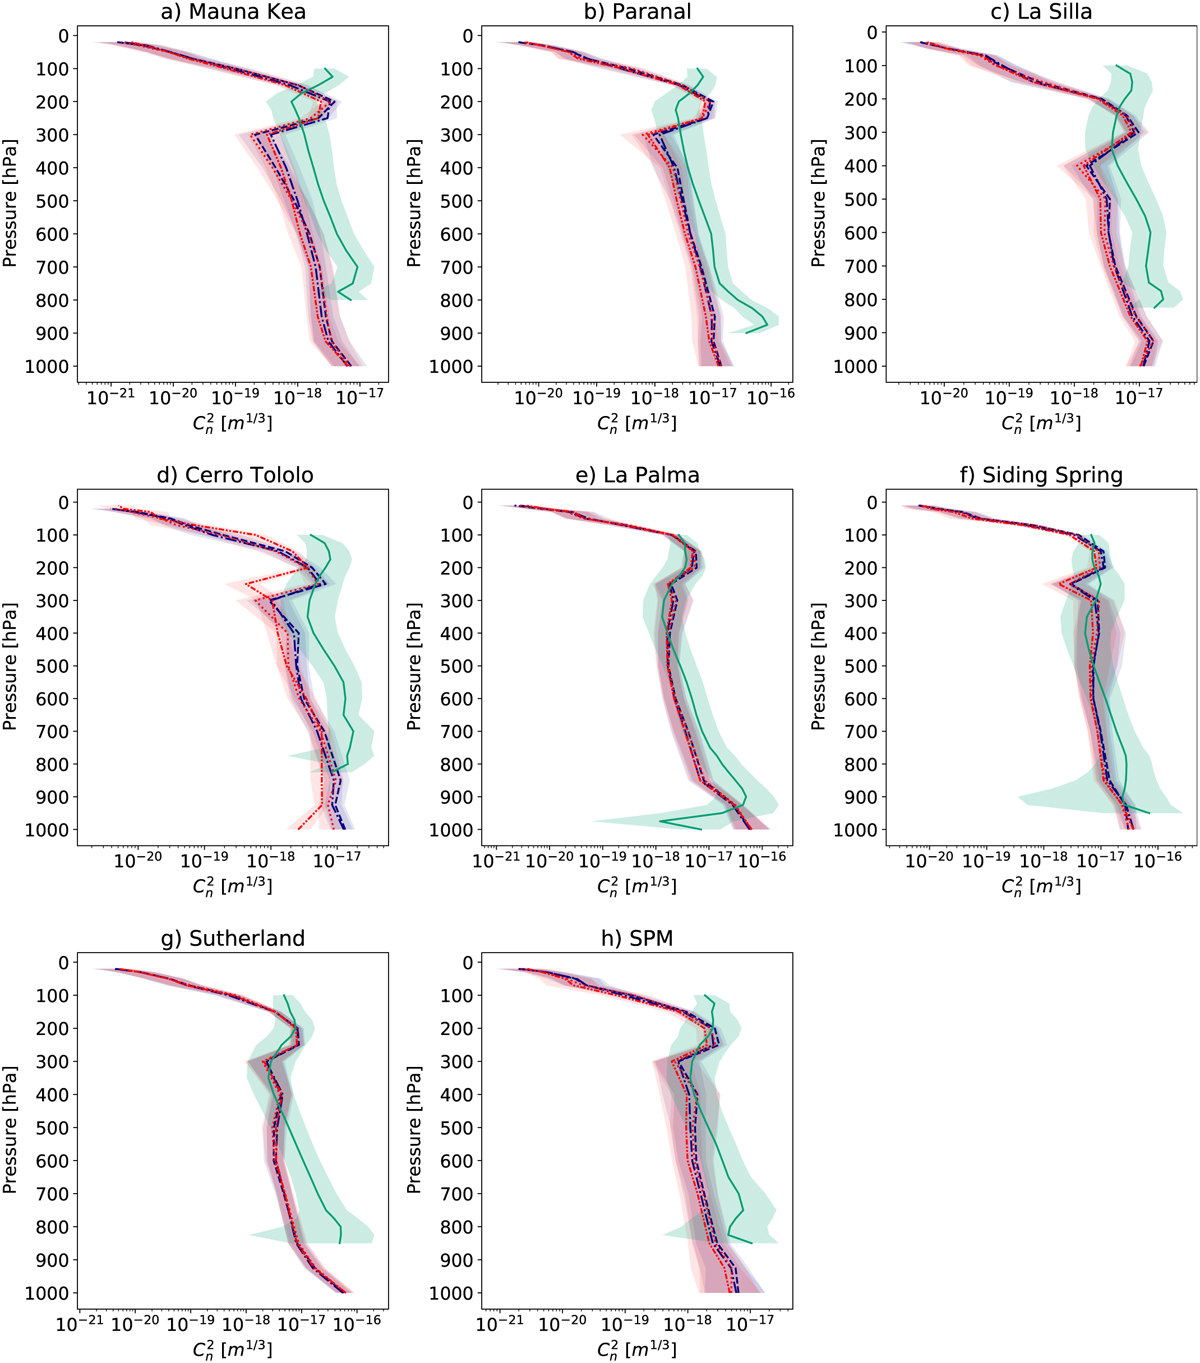
Fig. E.1
Download original image
Vertical profile of the refractive index structure constant for all sites in ERA5 (1979–2019, green) and PRIMAVERA coupled-past (dashed blue line), atmos-past (dash-dotted blue line), coupled-future (red dotted line) and atmos-future (red dash-dot-dotted line) simulations. The higher the, the higher the seeing value. The lines indicate the median, and the spread is represented by the interquartile range (IQR, shading) based on monthly mean data. Results for PRIMAVERA are computed as the model ensemble mean of the monthly-mean median.
Current usage metrics show cumulative count of Article Views (full-text article views including HTML views, PDF and ePub downloads, according to the available data) and Abstracts Views on Vision4Press platform.
Data correspond to usage on the plateform after 2015. The current usage metrics is available 48-96 hours after online publication and is updated daily on week days.
Initial download of the metrics may take a while.