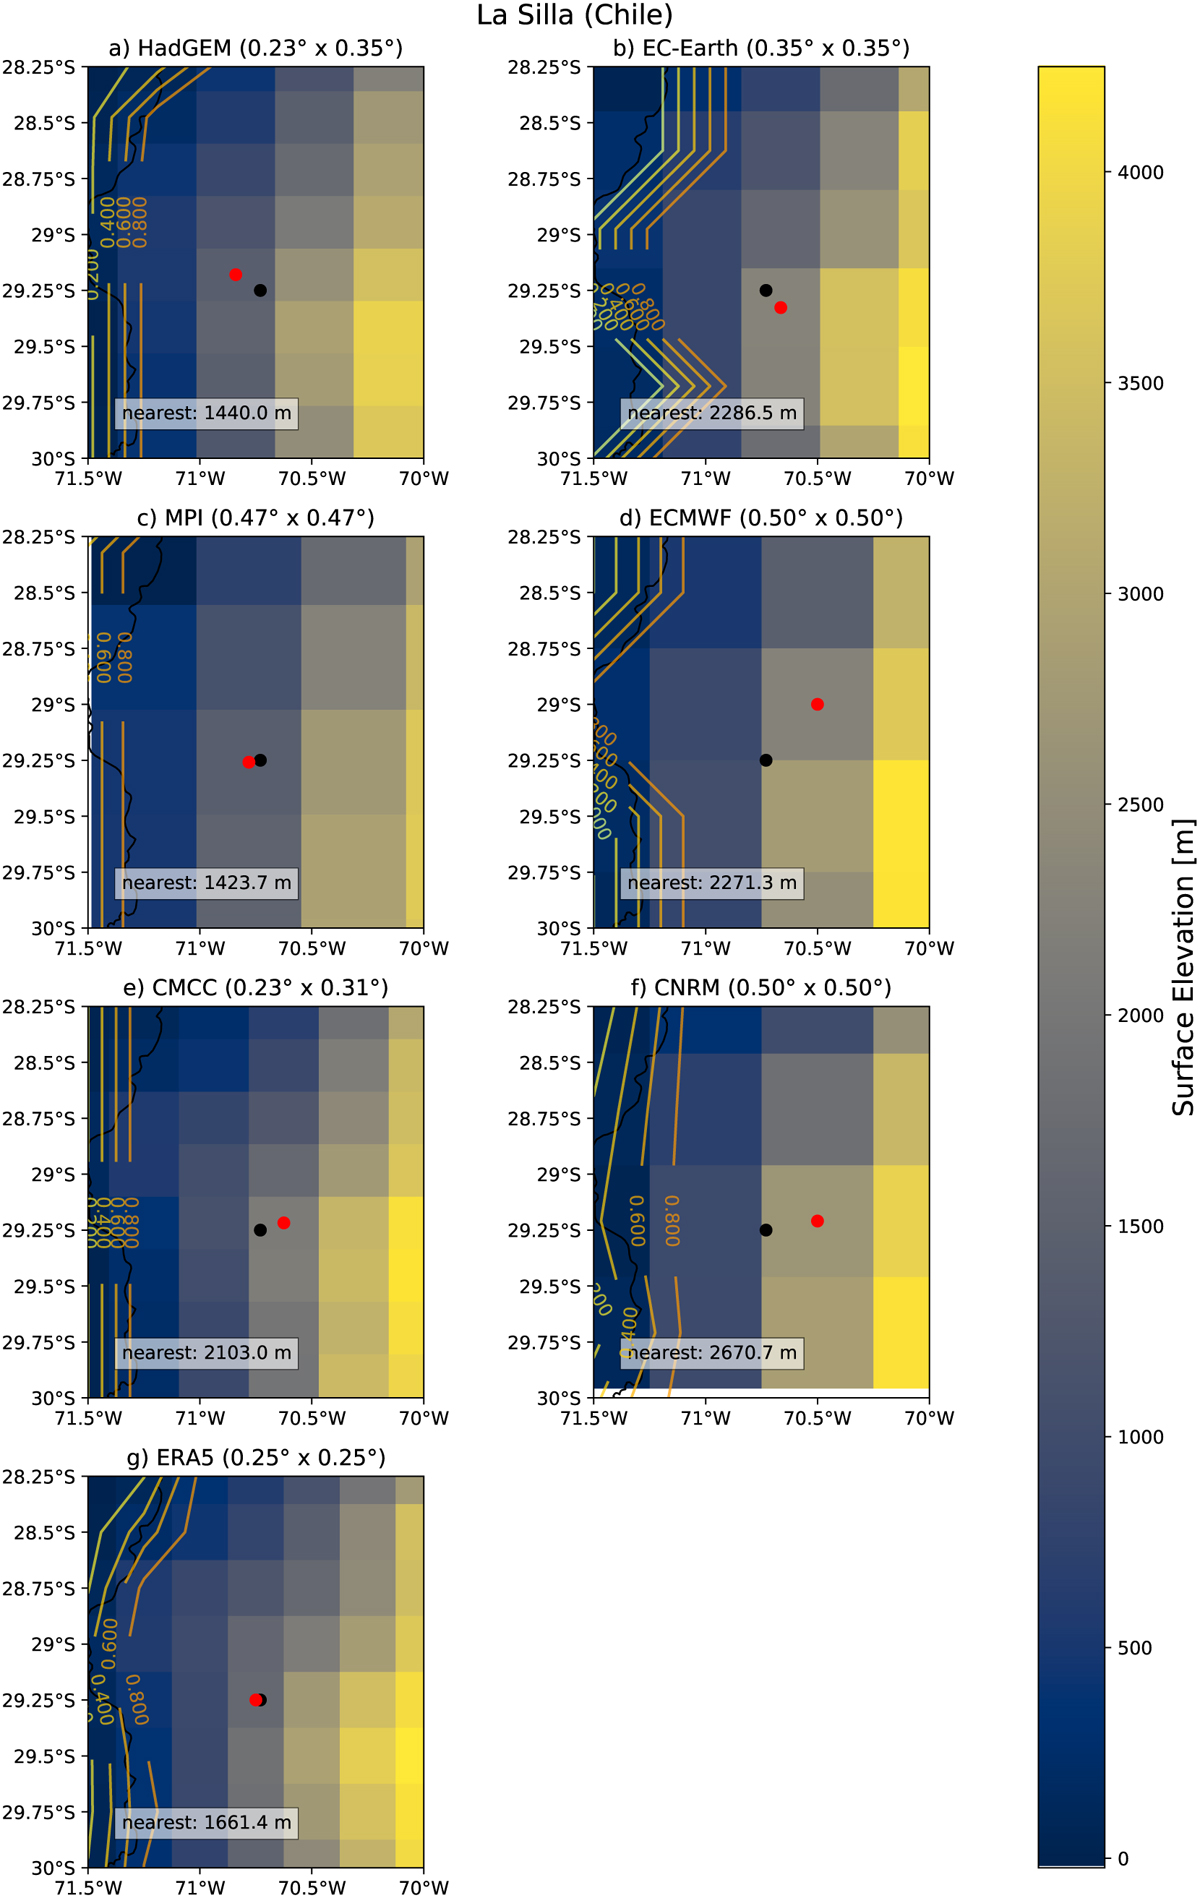
Fig. C.3
Download original image
Surface elevation (in m) of La Silla for PRIMAVERA (a-f) and ERA5 (g). Longitude is on the x-axis, latitude on the y-axis, both in degrees. The horizontal resolution of each model in this regional excerpt is given in degrees as latitude×longitude. The land-sea masks are shown with coloured contour lines, while the black contours represent the real border between land and sea. Black dots indicate the location of the La Silla observatory. The red dots indicate the models’ nearest grid point to the La Silla observatory. Its elevation is 2400 m. For a global map view of the site location, see Figure 1.
Current usage metrics show cumulative count of Article Views (full-text article views including HTML views, PDF and ePub downloads, according to the available data) and Abstracts Views on Vision4Press platform.
Data correspond to usage on the plateform after 2015. The current usage metrics is available 48-96 hours after online publication and is updated daily on week days.
Initial download of the metrics may take a while.