Fig. B.4
Download original image
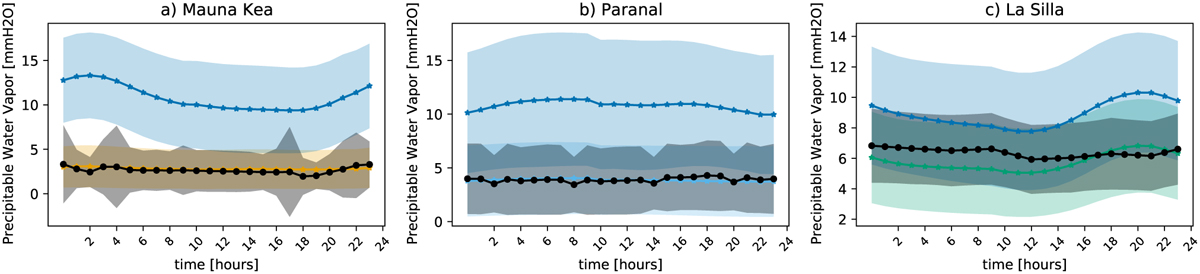
Diurnal cycle of PWV for in situ data (black markers) and ERA5 data (coloured markers). The ERA5 integrated PWV is shown as well as the ERA5 total column water output (‘tew’, blue). The grey and coloured shadings represent the standard deviation of the in situ and ERA5 data based on hourly averaged data, respectively. Time is in universal time (UT). In situ data are missing for Cerro Tololo, La Palma, Siding Spring, Sutherland and SPM. Data for La Silla is interpolated from 3-hourly data. The integration limit for the integrated PWV is 600 hPa for Mauna Kea (a, dark-yellow line), 750 hPa for Paranal (b, bright blue line) and 775 hPa for La Silla (c, green line).
Current usage metrics show cumulative count of Article Views (full-text article views including HTML views, PDF and ePub downloads, according to the available data) and Abstracts Views on Vision4Press platform.
Data correspond to usage on the plateform after 2015. The current usage metrics is available 48-96 hours after online publication and is updated daily on week days.
Initial download of the metrics may take a while.