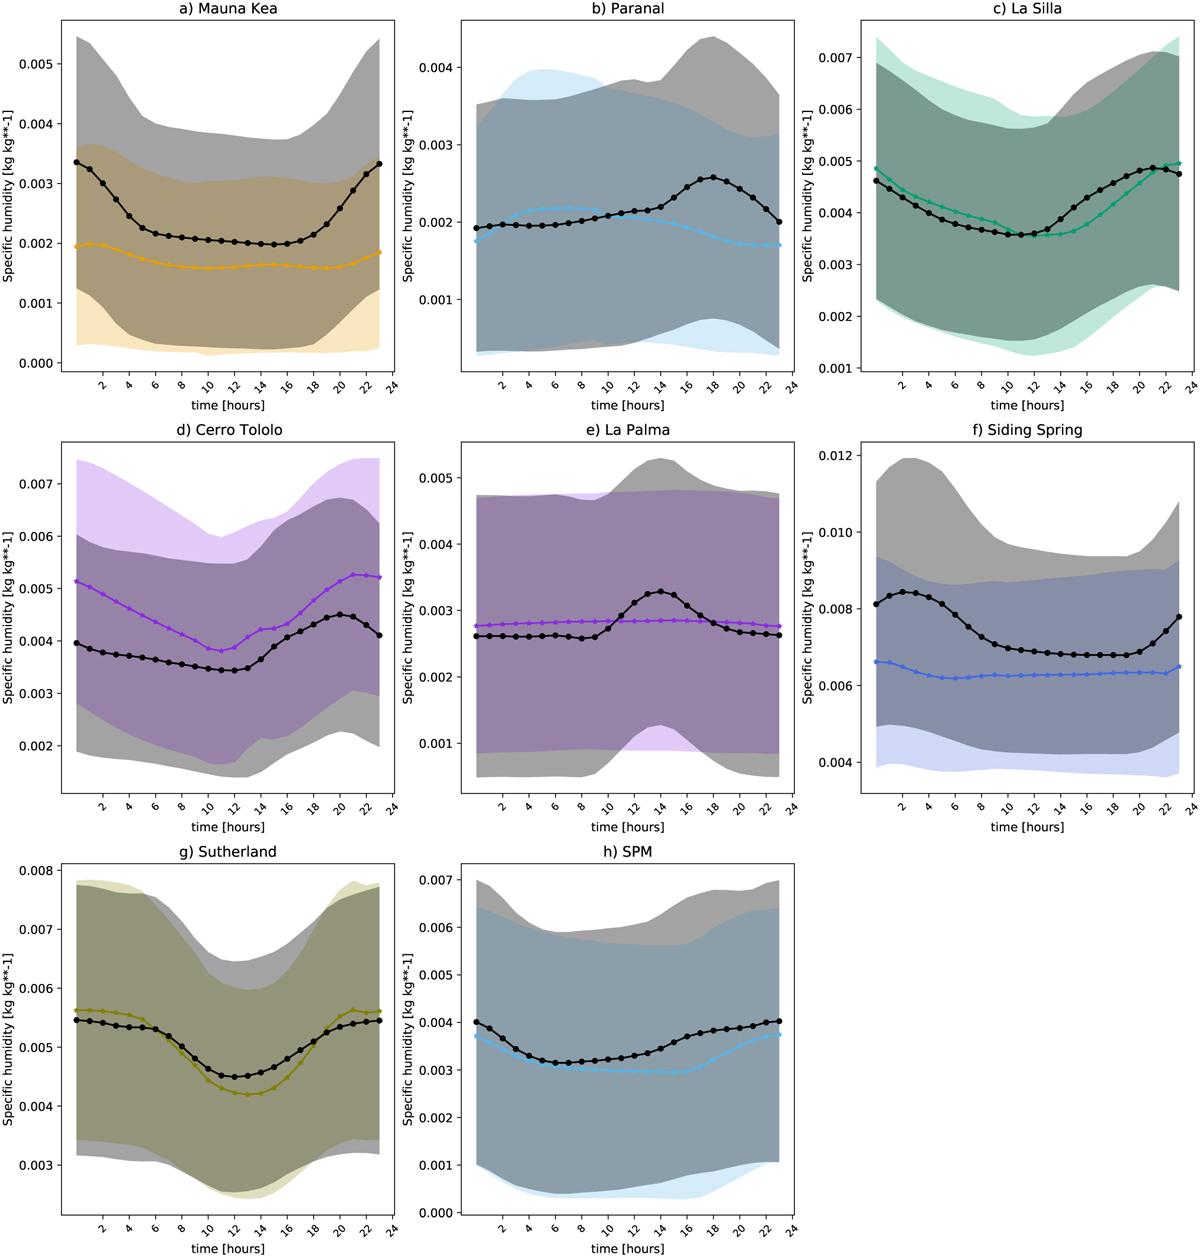
Fig. B.3
Download original image
Diurnal cycle of specific humidity for in situ data (black markers) and ERA5 data (coloured markers). The coloured lines indicate ERA5 data on pressure levels 600 hPa (dark-yellow; a), 750 hPa (bright blue; b and h), 775 hPa (green; c), 800 hPa (blue-violet; d and e), 850 hPa (olive; g) and 900 hPa (royalblue; f). The grey and coloured shadings represent the standard deviation of the in situ and ERA5 data based on hourly averaged data, respectively. Time is in universal time (UT).
Current usage metrics show cumulative count of Article Views (full-text article views including HTML views, PDF and ePub downloads, according to the available data) and Abstracts Views on Vision4Press platform.
Data correspond to usage on the plateform after 2015. The current usage metrics is available 48-96 hours after online publication and is updated daily on week days.
Initial download of the metrics may take a while.