Fig. 7.
Download original image
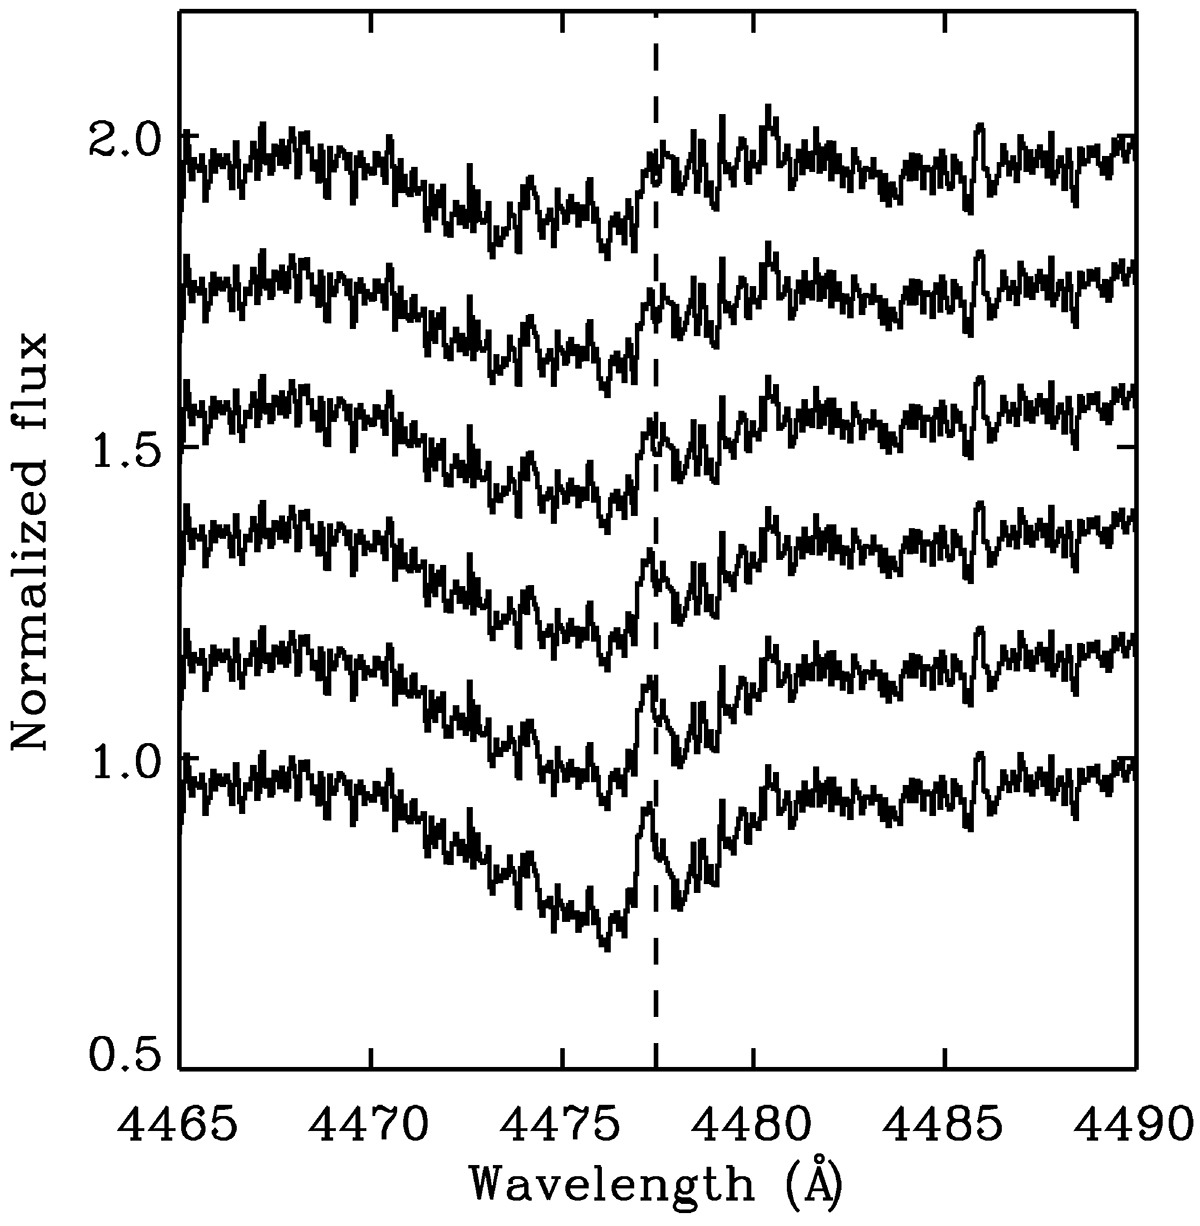
Illustration of the residual spectra obtained by subtracting theoretical spectra scaled by the fractional contribution from the HR06 OB2 data in the vicinity of He I 4471 Å line. The value of log g increases in steps if 0.25 dex from log g = 3.00 dex for the lower curve to 4.25 dex for the uppermost curve, spectra are offset by 0.2 normalized flux units. Teff values follow the relationship shown in Fig. 5. The emission feature at the position of the He I line core (dashed line), caused by over-subtraction of the Doppler core in the model, becomes weak or absent for log g > 3.75.
Current usage metrics show cumulative count of Article Views (full-text article views including HTML views, PDF and ePub downloads, according to the available data) and Abstracts Views on Vision4Press platform.
Data correspond to usage on the plateform after 2015. The current usage metrics is available 48-96 hours after online publication and is updated daily on week days.
Initial download of the metrics may take a while.