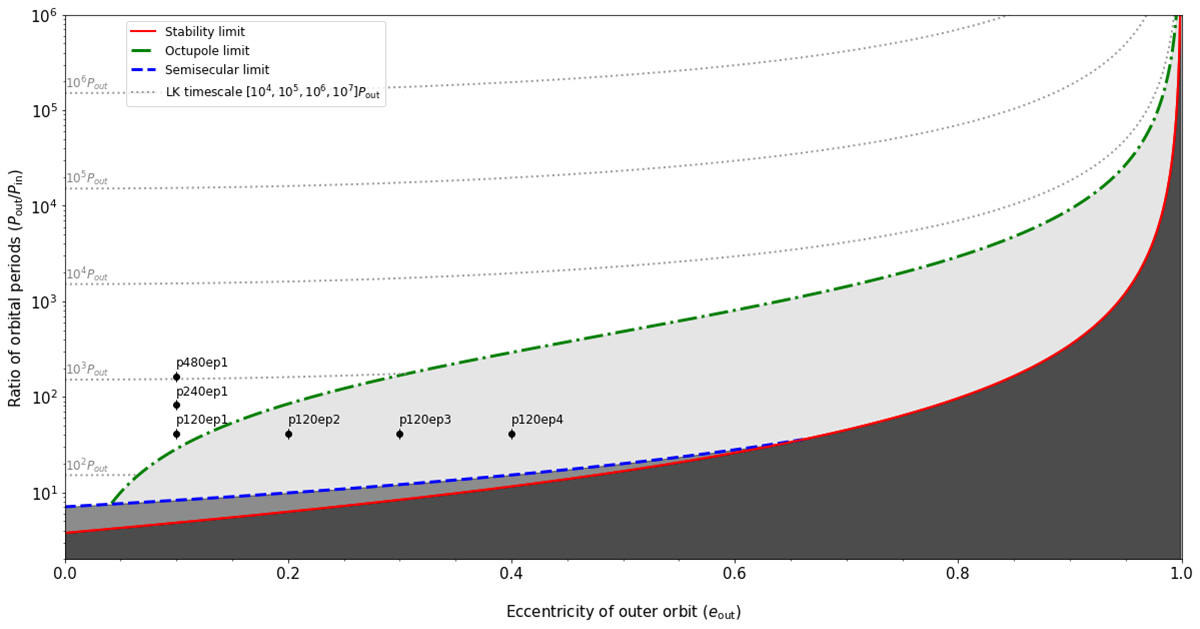
Fig. 17.
Download original image
Visualization of stability criteria for the triple systems (Toonen et al. 2020, where further details can be found), the shaded area below the red line indicating unstable configurations. The locations of test models are illustrated, assuming m1 = 25, m2 = 8.6, m3 = 6 M⊙, and Pin = 2.92 d. The range of outer periods and eccentricities are indicated by the labels, for example the model p120ep1 assumes Pout = 120 d and an eccentricity of 0.1 for the outer system. All test models assume prograde orbits of 87° inclination of the orbital planes.
Current usage metrics show cumulative count of Article Views (full-text article views including HTML views, PDF and ePub downloads, according to the available data) and Abstracts Views on Vision4Press platform.
Data correspond to usage on the plateform after 2015. The current usage metrics is available 48-96 hours after online publication and is updated daily on week days.
Initial download of the metrics may take a while.