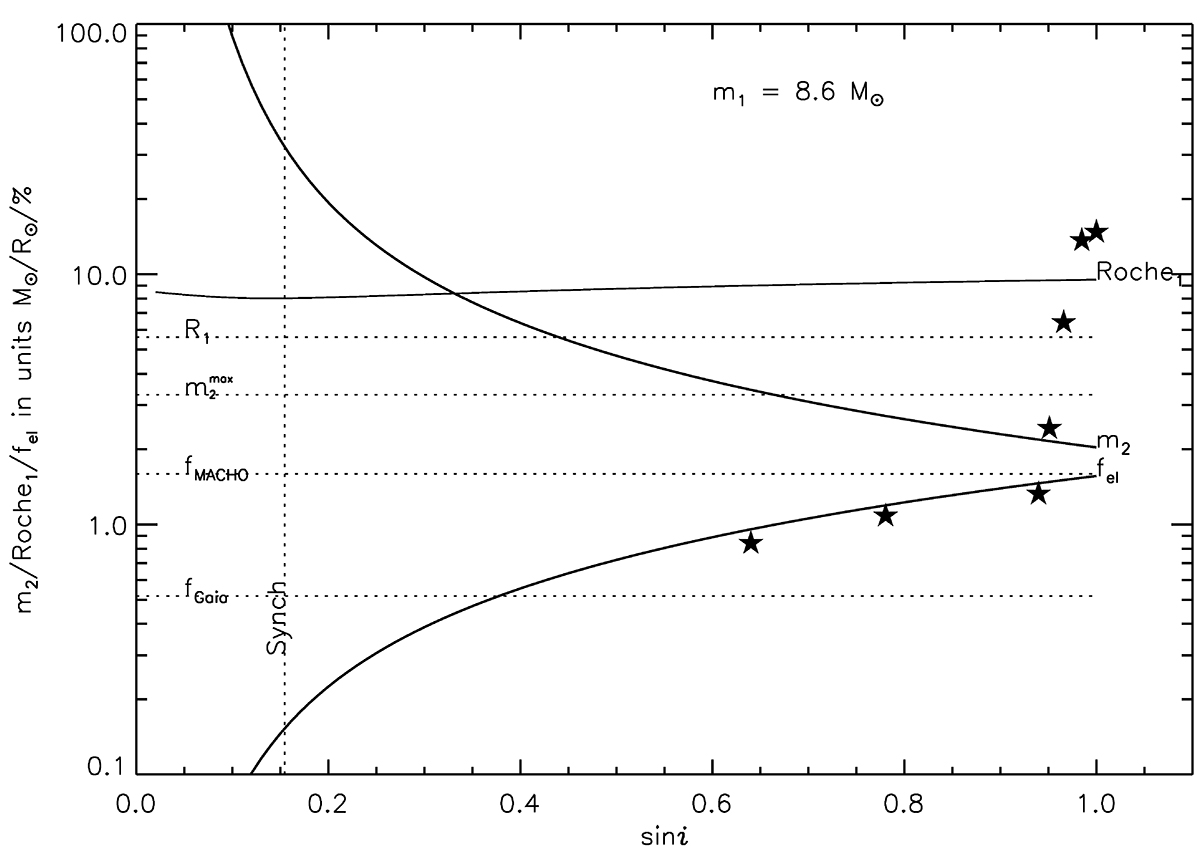
Fig. 14.
Download original image
Diagnostic diagram assuming a main sequence primary with a mass of 8.6 M⊙. The solid curves represent, as a function of sini, the secondary mass (labeled m2), the Roche radius of the primary (Roche1), and the maximum percentage amplitude of ellipsoidal light variations expected (fel) of the primary. Filled stars (⋆) illustrate the percentage amplitude of ellipsoidal light variations predicted by nightfall assuming a binary consisting of the proposed primary and a main sequence secondary of appropriate mass and radius. The increase at high sini indicates the presence of an eclipse. Dotted horizontal lines illustrate the constraints implied by the observations, the stellar radius (R1), the limits on ellipsoidal light variations (fMACHO and fGaia), and the maximum mass that is consistent with the absence of secondary stellar spectrum in the data. The vertical line (labeled Synch) indicates the upper limit on sin i implied by synchronous rotation and our measured upper limit on ve sin i of 15 km s−1.
Current usage metrics show cumulative count of Article Views (full-text article views including HTML views, PDF and ePub downloads, according to the available data) and Abstracts Views on Vision4Press platform.
Data correspond to usage on the plateform after 2015. The current usage metrics is available 48-96 hours after online publication and is updated daily on week days.
Initial download of the metrics may take a while.