Fig. 11.
Download original image
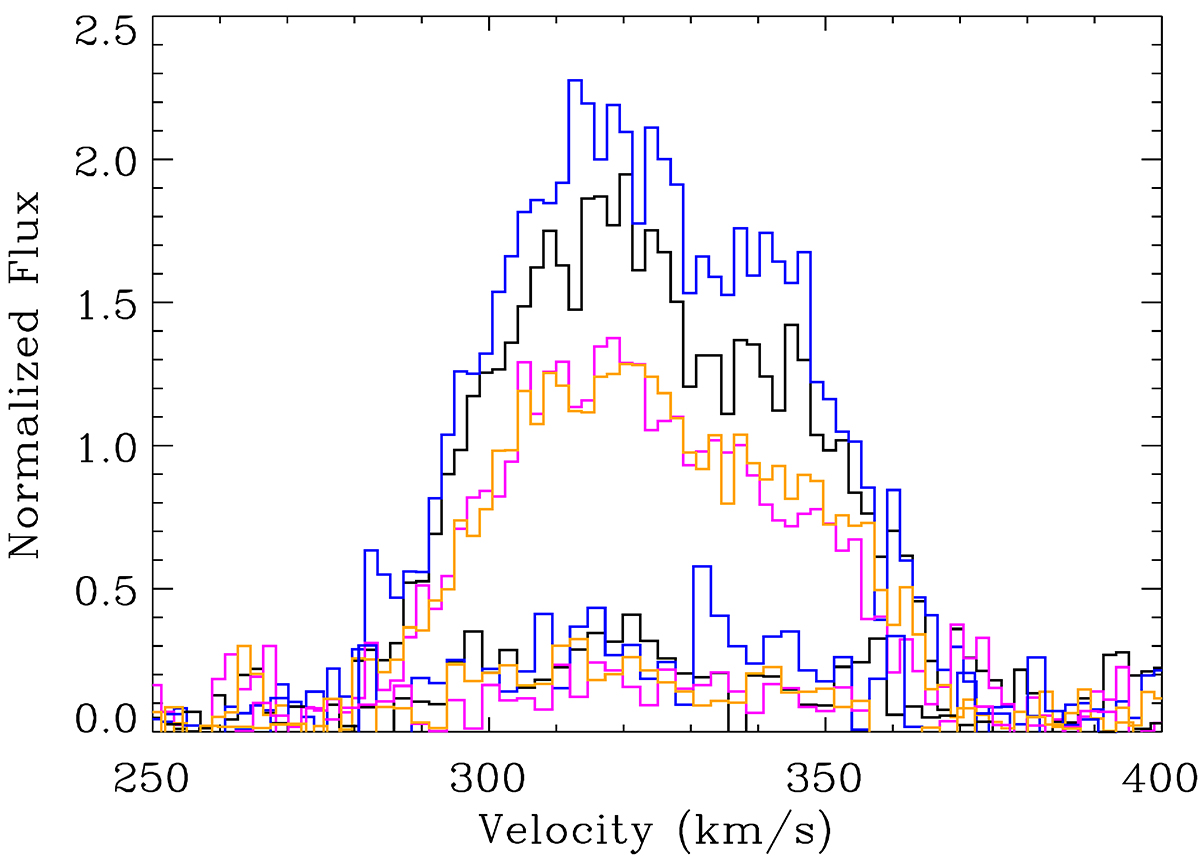
SALT-HRS line profile morphology in velocity space of Hα (upper four curves) and Hβ (lower four curves), color coded by observation; black – obs1, blue – obs2, magenta – obs3 and orange – obs4. The primary’s underlying profiles have been subtracted from these data. While the Hα profiles exhibit some variability of intensity their velocities are quite constant, and are well modeled with two-component Gaussian fit with velocities at 314 km s−1 (for the ambient nebular emission) and ∼325 km s−1 (for the source emission). The latter has a FWHM of ∼60 km s−1.
Current usage metrics show cumulative count of Article Views (full-text article views including HTML views, PDF and ePub downloads, according to the available data) and Abstracts Views on Vision4Press platform.
Data correspond to usage on the plateform after 2015. The current usage metrics is available 48-96 hours after online publication and is updated daily on week days.
Initial download of the metrics may take a while.