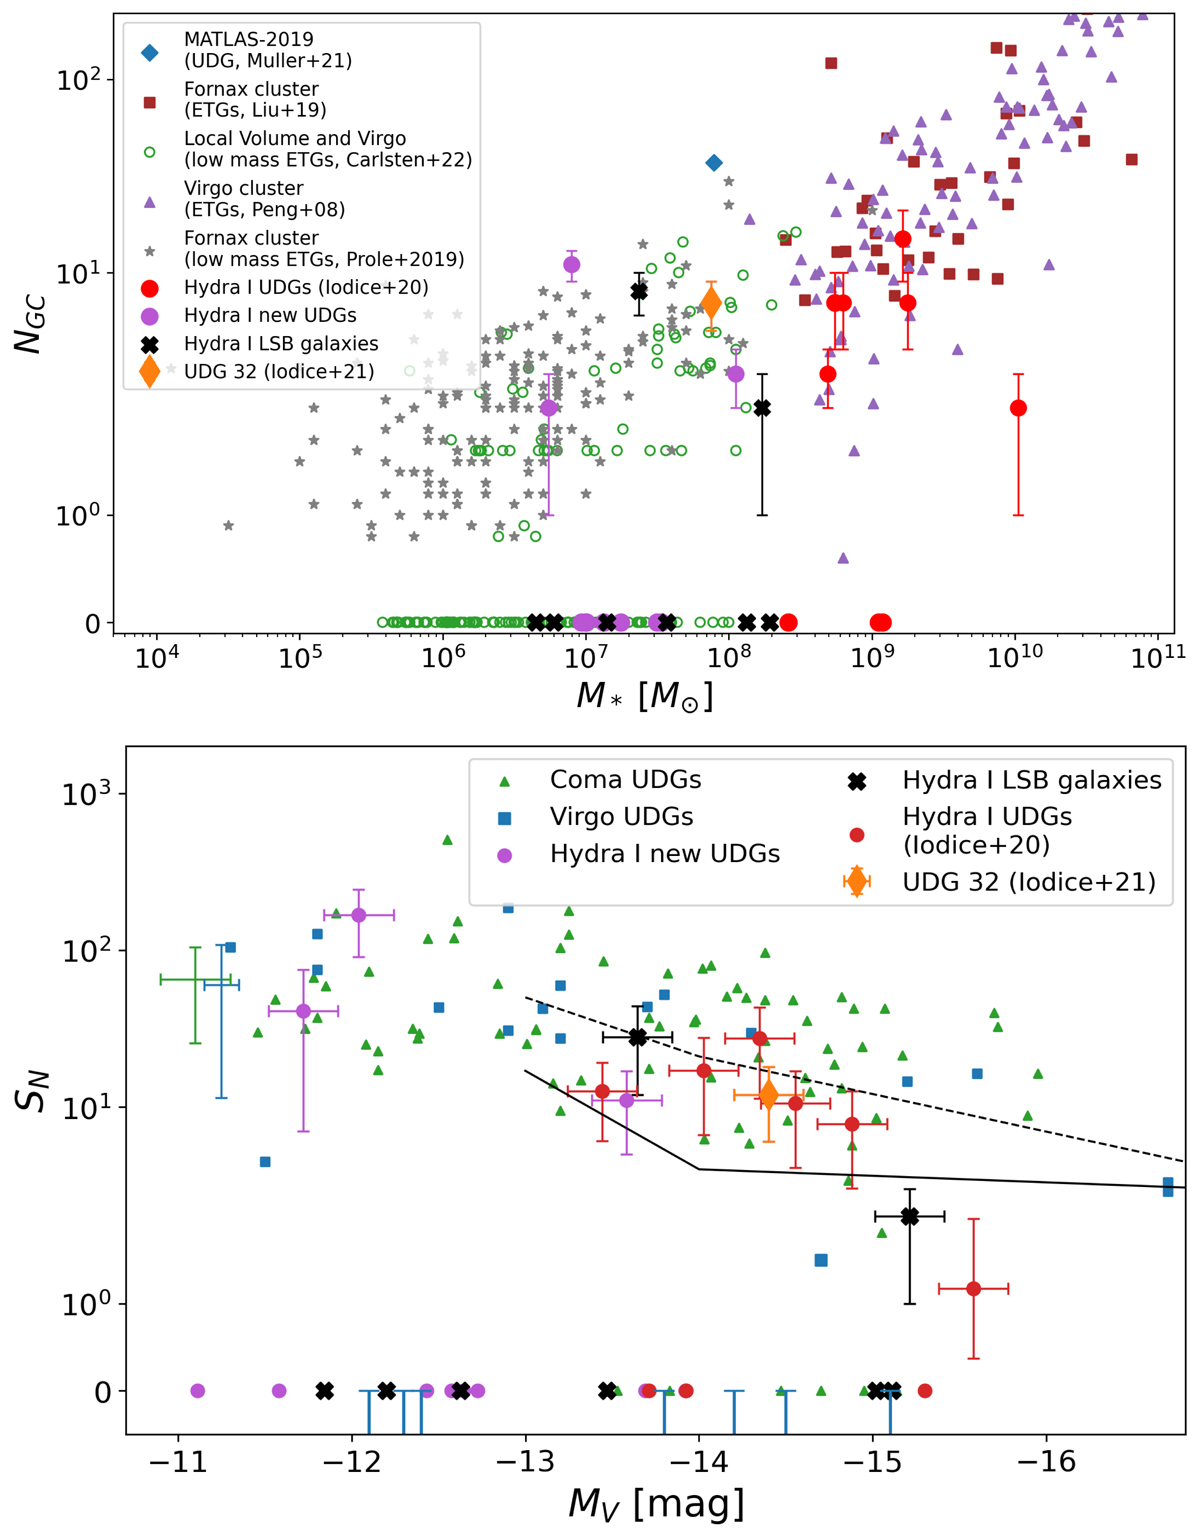
Fig. 8.
Download original image
Top panel: number of GCs as a function of the host galaxy stellar mass. Filled purple circles are the new UDGs in our sample, while filled black crosses are Hydra I new LSB galaxies. Filled red circles are Hydra I UDGs from Iodice et al. (2020), and the orange thin diamond is UDG32 (Iodice et al. 2021). High-surface-brightness and LSB galaxies from other low- and high-density environments are plotted for comparison. We show the Fornax and Virgo ETGs (Liu et al. 2019; Peng et al. 2008, respectively), the Fornax low-mass ETGs (Prole et al. 2019a), the Local Volume and Virgo low-mass ETGs (Carlsten et al. 2022), and the MATLAS-2019 UDG (Müller et al. 2021) (markers are indicated in the legend). Bottom panel: GC-specific frequency SN versus V-band absolute magnitude for UDGs and new LSB galaxies in the Hydra I cluster (symbols as in the top panel, Iodice et al. 2020, and this work), compared to the UDGs in the Coma cluster (green triangles, Forbes et al. 2020a), and to the UDGs in the Virgo cluster (blue squares, Lim et al. 2020). Virgo UDGs with a negative specific frequency are reported at SN = 0. In all three cases, GCs are selected within 1.5Re and are locally corrected for background contamination. The solid line shows the mean locus of dwarf galaxies, the dashed line represents the upper 2σ bound (see also Fig. 4 in Lim et al. 2018). The average uncertainties on Coma and Virgo are shown on the left side.
Current usage metrics show cumulative count of Article Views (full-text article views including HTML views, PDF and ePub downloads, according to the available data) and Abstracts Views on Vision4Press platform.
Data correspond to usage on the plateform after 2015. The current usage metrics is available 48-96 hours after online publication and is updated daily on week days.
Initial download of the metrics may take a while.