Fig. 6.
Download original image
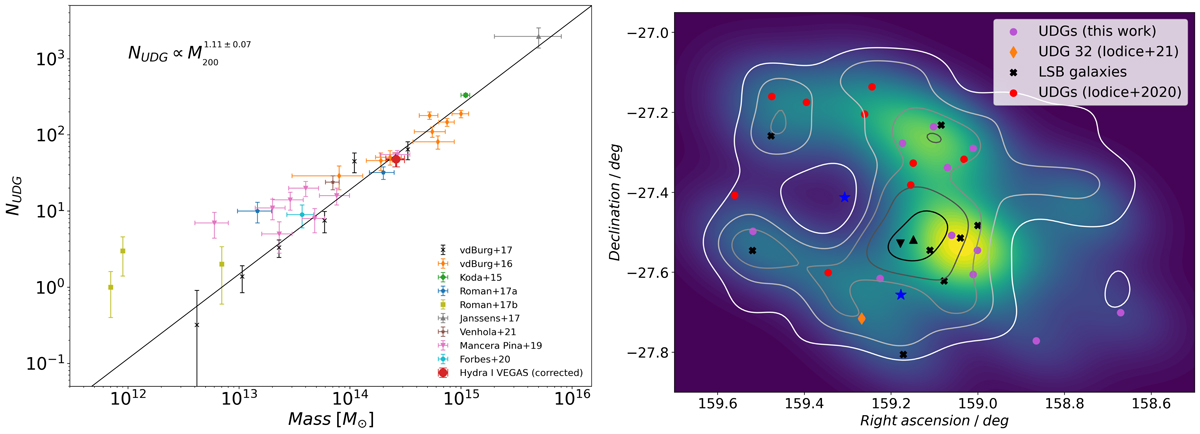
UDG numerical abundance and spatial distribution. Left panel: abundance of UDGs as a function of the halo mass for available data (van der Burg et al. 2017, 2016; Koda et al. 2015; Román & Trujillo 2017a,b; Janssens et al. 2017; Mancera Piña et al. 2019; Forbes et al. 2020b; Venhola et al. 2022). For the Hydra I cluster, the number of UDGs within ≈0.4Rvir is scaled to NUDG(≤Rvir) on an assumed radial number density distribution (see Sect. 5.1). The black line represents the relation fitted by van der Burg et al. (2017), the equation for which is reported in the plot. Right panel: 2D projected distribution of all the UDGs detected in the Hydra I cluster, and of the 8 LSB galaxies presented in this work (sequential color map). Contours represent the density distribution of dwarf galaxies (see Paper I), with increasing density from white to black. The two brightest cluster members NGC 3311 and NGC 3309 are marked as black triangles. The locations of the two brightest stars in the field are also indicated as blue stars.
Current usage metrics show cumulative count of Article Views (full-text article views including HTML views, PDF and ePub downloads, according to the available data) and Abstracts Views on Vision4Press platform.
Data correspond to usage on the plateform after 2015. The current usage metrics is available 48-96 hours after online publication and is updated daily on week days.
Initial download of the metrics may take a while.