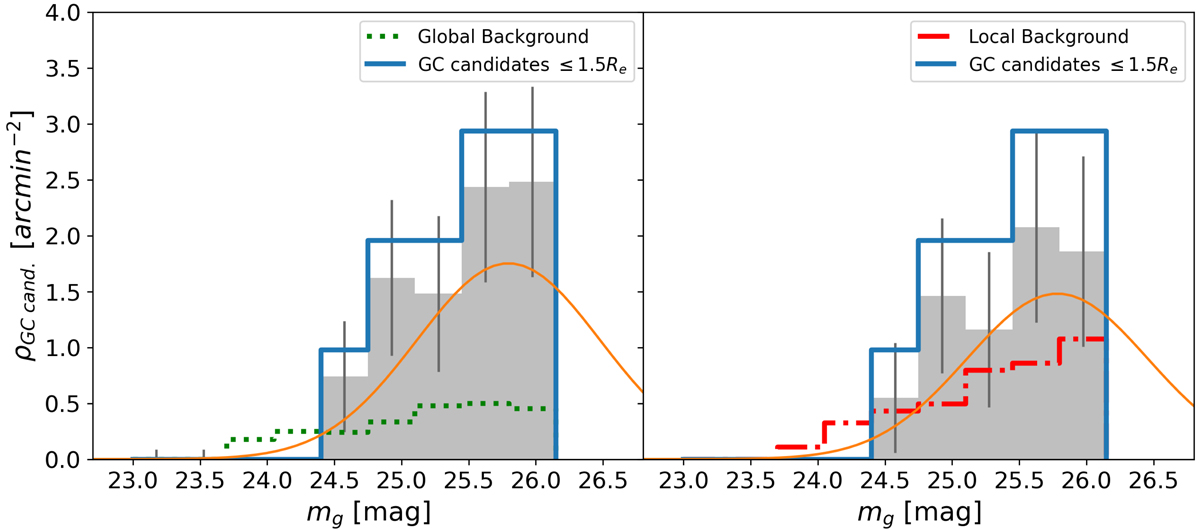
Fig. 5.
Download original image
Total luminosity function of the GC candidates over the joint sample of UDGs and LSB galaxies (Table 3) with NGC ≥ 0 within 1.5Re normalized to the total galaxy area (solid blue line). Left: GCLF globally corrected. The density distribution for the global background is shown with green dotted line. The gray shaded histogram shows the residuals of the two. The solid line shows the best-fit Gaussian function of the GC luminosity function (gray bins). The best-fit parameters are: μg, TOM = 25.8 ± 0.3 mag, σGCLF = 0.69 ± 0.12 mag. Right: As left panel, but using the local background (red dot-dashed line). The best-fit parameters are: μg, TOM = 25.8 ± 0.2 mag, σGCLF = 0.66 ± 0.14 mag. The error bars show the uncertainties on the residual GC density calculated as detailed in Sect. 4.
Current usage metrics show cumulative count of Article Views (full-text article views including HTML views, PDF and ePub downloads, according to the available data) and Abstracts Views on Vision4Press platform.
Data correspond to usage on the plateform after 2015. The current usage metrics is available 48-96 hours after online publication and is updated daily on week days.
Initial download of the metrics may take a while.