Fig. 3.
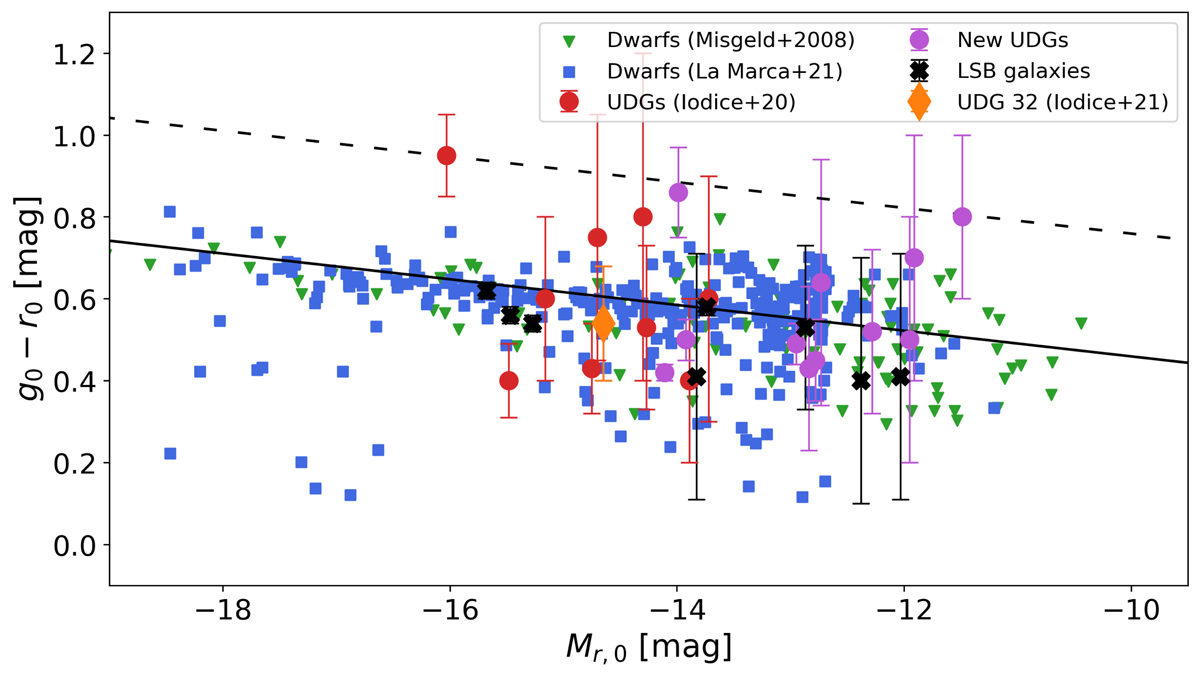
Download original image
Color–magnitude diagram for the full sample of dwarfs, LSB galaxies, and UDGs detected in the VST Hydra I mosaic. The newly detected UDGs are shown as magenta filled circles, while black crosses indicate the new LSB galaxies. Blue filled squares are dwarf galaxies presented in Paper I, red points are the UDGs found by Iodice et al. (2020), and the green triangles are the Hydra I galaxies presented by Misgeld et al. (2008). The solid black line is the CMR for the Hydra I cluster early-type galaxies, with its upper 2σ scatter limit (dashed line), as derived by Misgeld et al. (2008): (g − r) = − 0.0314 ⋅ Mr + 0.145, σ = 0.15.
Current usage metrics show cumulative count of Article Views (full-text article views including HTML views, PDF and ePub downloads, according to the available data) and Abstracts Views on Vision4Press platform.
Data correspond to usage on the plateform after 2015. The current usage metrics is available 48-96 hours after online publication and is updated daily on week days.
Initial download of the metrics may take a while.