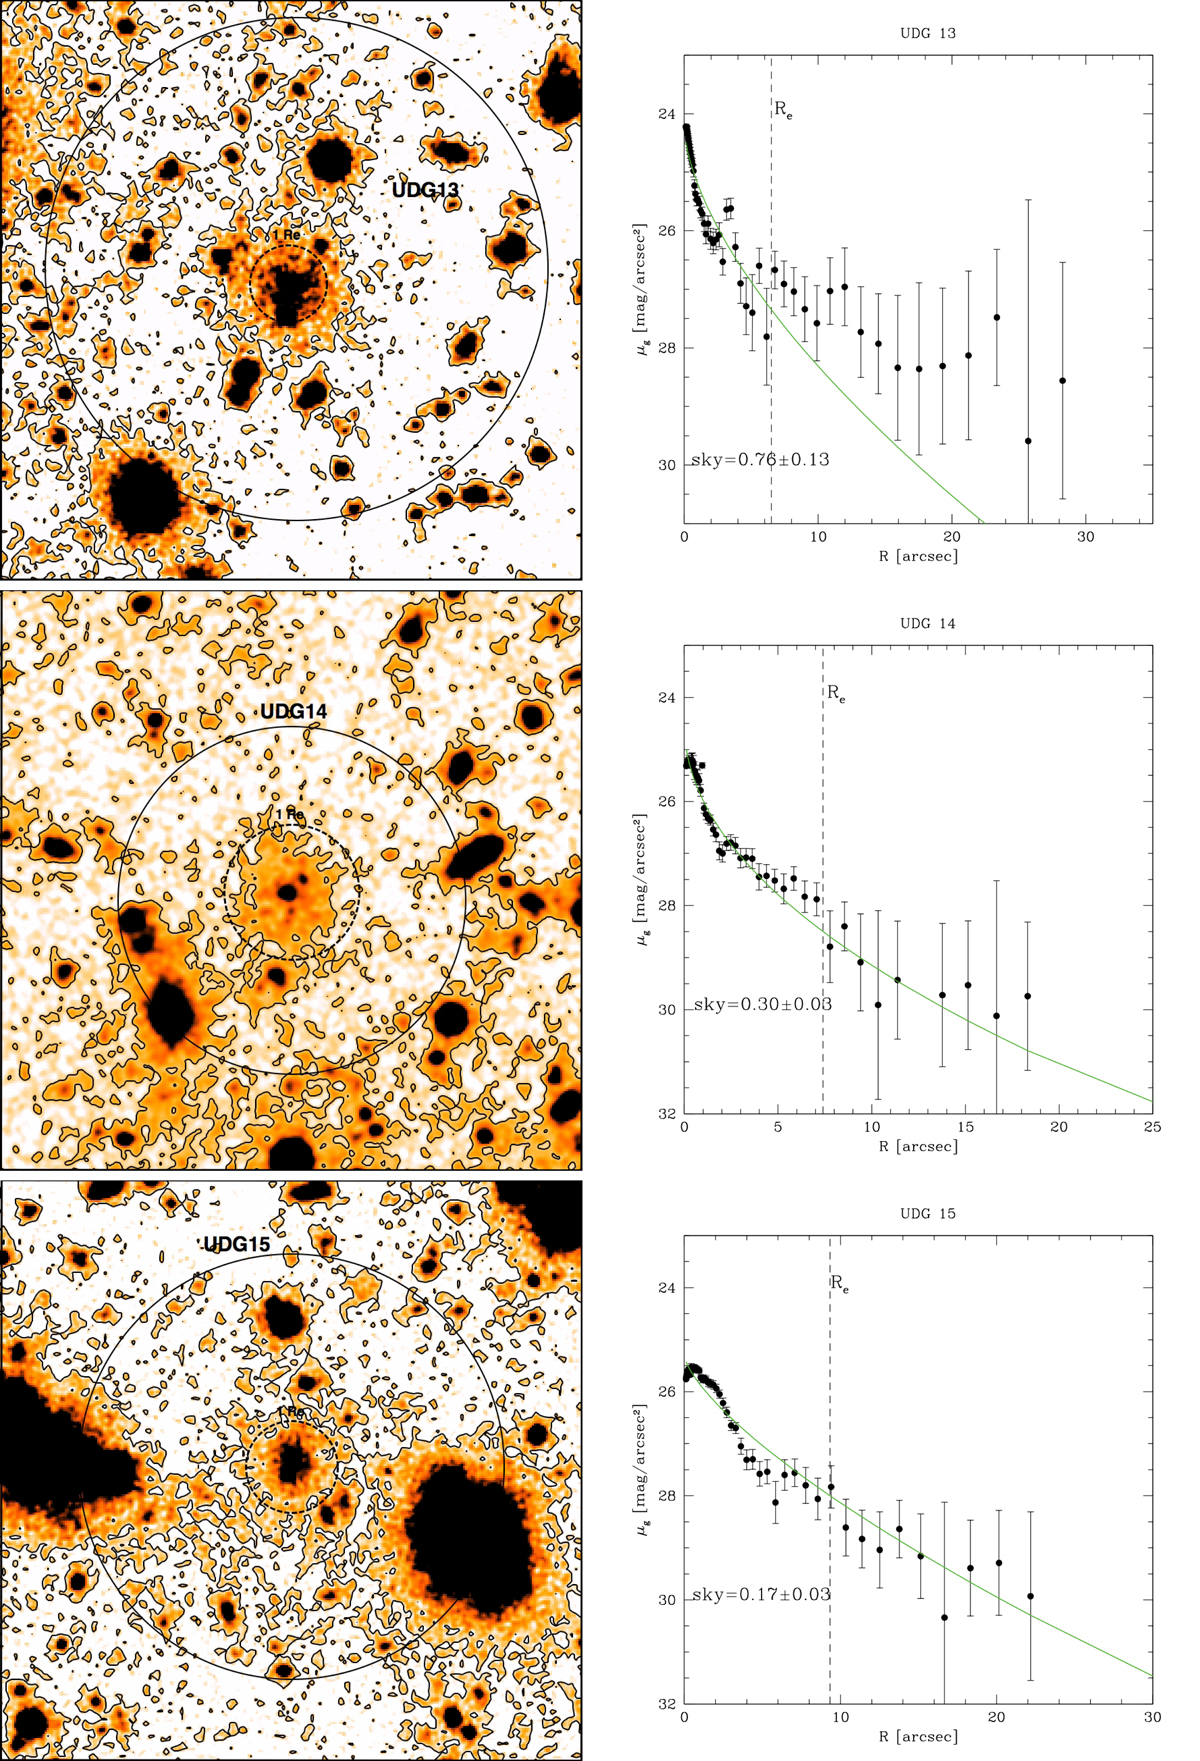
Fig. C.1.
Download original image
Light distribution of the UDG candidates in the g band. Left panel: Image thumbnail centered on the UDG of 1 × 1 arcmin (∼14.9 kpc). The black dashed circle corresponds to 1Re, listed in Tab. 1. The black solid circle marks the outermost radius where flux blends into the sky level. This corresponds to the outermost data point shown in the plot in the right panel. The black solid contours correspond to μg = 29 mag/arcsec2. Right panel: Azimuthally averaged surface brightness profile (black points) of the UDG shown in the left panel as a function of the semi-major axis radius, and the best-fit model (green solid line). The vertical dashed line indicates the effective radius derived from the best-fit model. The local sky level (in counts) is reported in the lower-left corner of the plot.
Current usage metrics show cumulative count of Article Views (full-text article views including HTML views, PDF and ePub downloads, according to the available data) and Abstracts Views on Vision4Press platform.
Data correspond to usage on the plateform after 2015. The current usage metrics is available 48-96 hours after online publication and is updated daily on week days.
Initial download of the metrics may take a while.