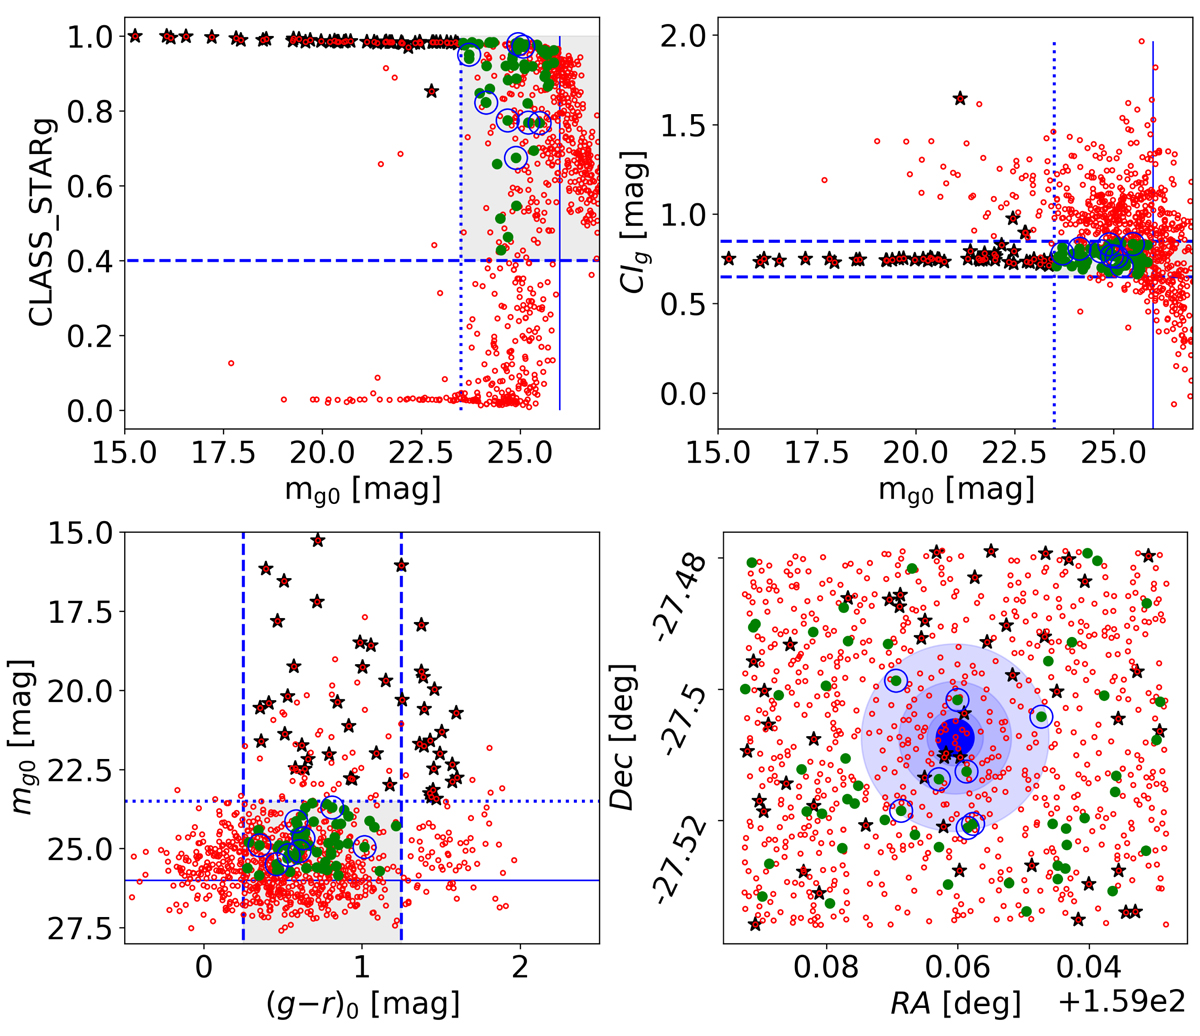
Fig. A.1.
Download original image
Globular cluster selection process and cuts for UDG 13. Red dots are all the sources detected in the 20Re × 20Re cutout centered on the galaxy. The green filled dots are all the sources matching the GC selection criteria described in Sec. 4. The blue empty circles around the green filled dots identify GC candidates within 5Re of the UDG. Black-filled five-pointed stars mark bright point sources, likely MW stars. Upper left: g-band CLASS_STAR vs. magnitude. The thin solid blue line at 26 mag represents the TOM, the blue dotted line is the the 3σGCLF brighter selection cut. The horizontal blue dashed line shows the adopted star/galaxy cut. Upper right:g-band concentration index CI vs. magnitude. Vertical lines are the same as the upper left panel, while horizontal blue dashed lines show the ±0.1 mag region around the local CIg sequence of point sources. Bottom left: Color–magnitude diagram. The dashed blue lines show the 0.25 ≤ (g − r)0 ≤ 1.25 mag color cut. The other lines are as in previous panels. Bottom right : UDG 13 cutout field. Concentric shaded blue circles represent the 1, 1.5, 3, and 5 Re regions.
Current usage metrics show cumulative count of Article Views (full-text article views including HTML views, PDF and ePub downloads, according to the available data) and Abstracts Views on Vision4Press platform.
Data correspond to usage on the plateform after 2015. The current usage metrics is available 48-96 hours after online publication and is updated daily on week days.
Initial download of the metrics may take a while.