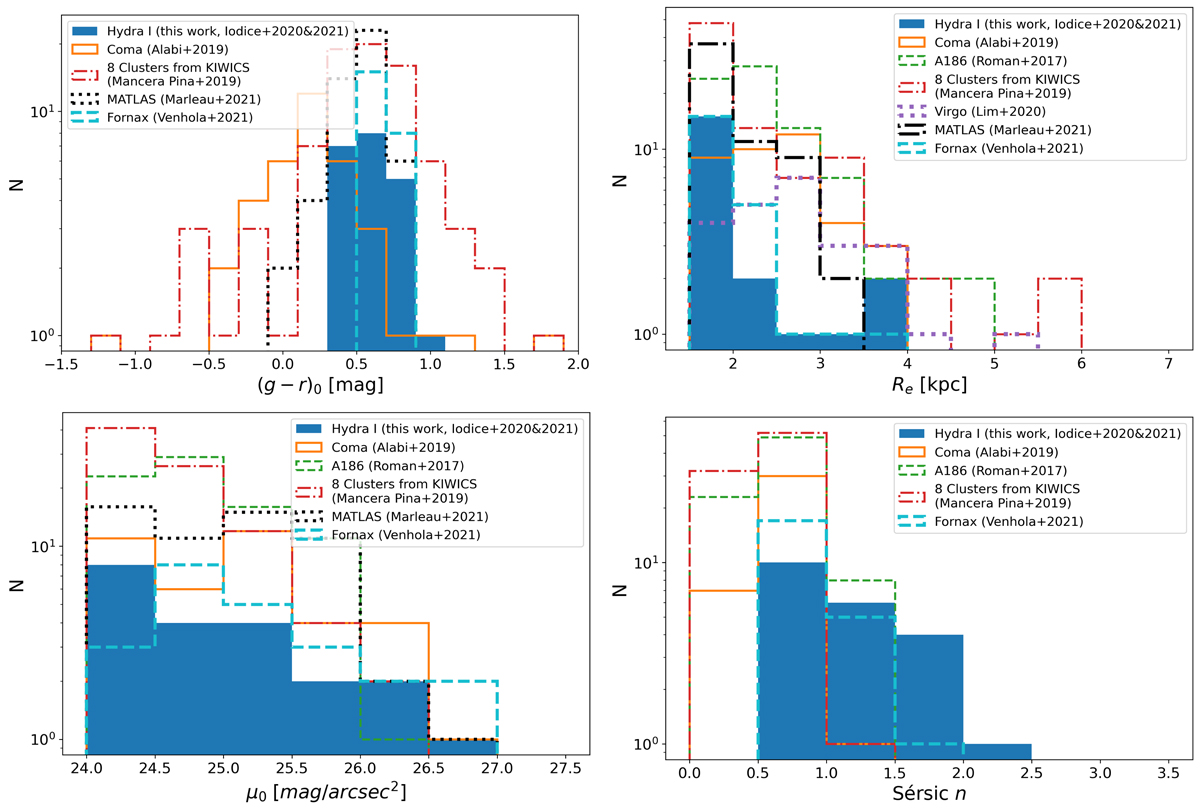
Fig. 10.
Download original image
Distribution of the structural parameters of UDGs in the Hydra I cluster (filled blue histogram) compared to UDGs in other environments, as listed in the legend of each panel. For each sample, we restricted the analysis to those UDGs that strictly respect the van Dokkum et al. (2015) definition. Optical g − r color (upper-left panel), effective radius Re (upper-right), central surface brightness μ0 (bottom-right), and Sérsic index n (bottom-right) are compared. References are given in the legend of each panel.
Current usage metrics show cumulative count of Article Views (full-text article views including HTML views, PDF and ePub downloads, according to the available data) and Abstracts Views on Vision4Press platform.
Data correspond to usage on the plateform after 2015. The current usage metrics is available 48-96 hours after online publication and is updated daily on week days.
Initial download of the metrics may take a while.