Fig. 8.
Download original image
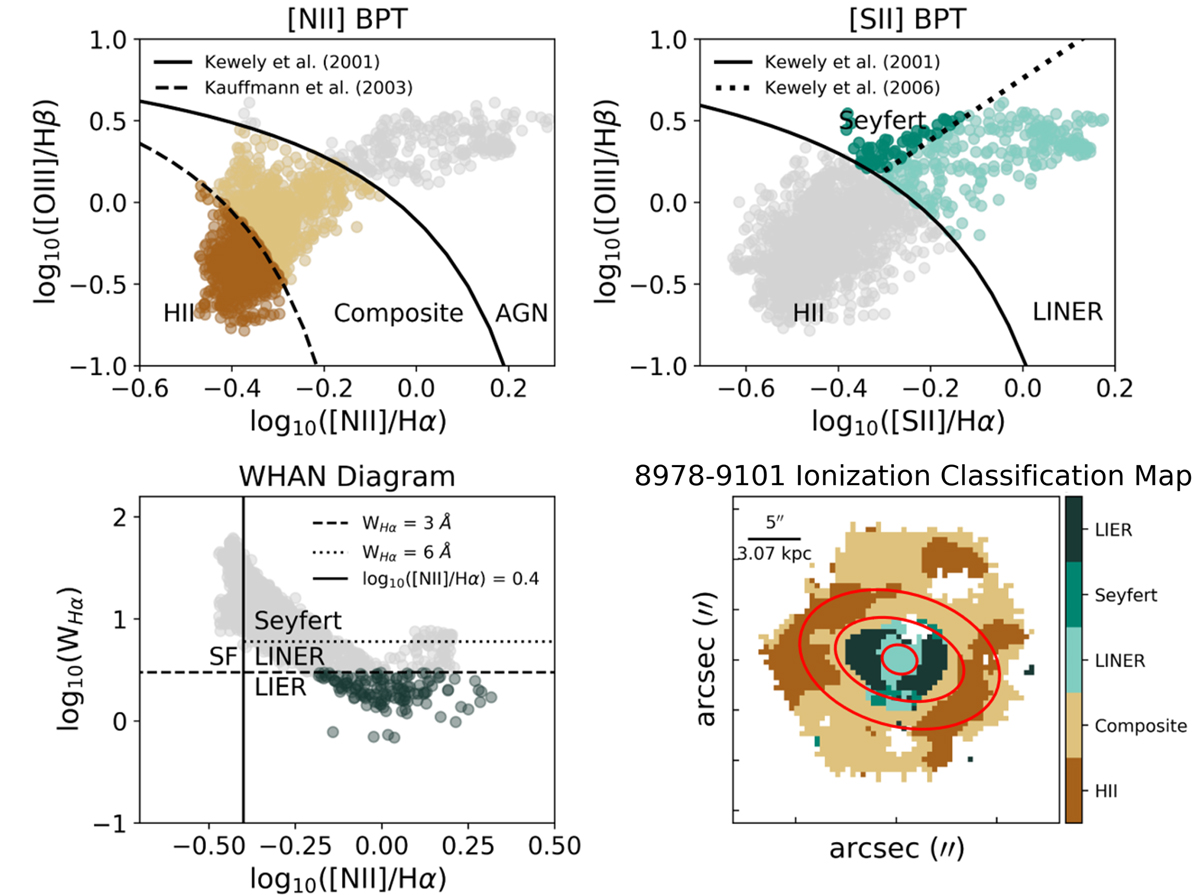
Example of the diagrams used to determine the gas excitation mechanisms across the surface of each galaxy. Each point on the diagrams represents a spaxel. Top row from left to right: [NII] BPT diagram and [SII] BPT diagram of a late-type RDAGN galaxy example. The solid line represents the maximum starburst line from Kewley et al. (2001). The dashed line on the [NII] BPT diagram represents the Kauffmann et al. (2003) line, which separates pure SF galaxies from composite galaxies. The dotted line on the [SII] BPT diagram separates Seyfert-like excitation from LINER-like excitation (Kewley et al. 2006). Bottom row from left to right: WHAN diagram and final ionization classification map of RDAGN galaxy 8978−9101. The [NII] BPT was used to separate HII (brown) and composite (beige) excitation, the [SII] diagram was used to distinguish Seyfert-like excitation (green) from LINER-like excitation (light green), and the WHAN diagram was used to differentiate LIER-like excitation (dark green) from LINER-like excitation. The red ellipses represent, from the inside outward, 0.2 R/Re, 0.6 R/Re, 1 R/Re.
Current usage metrics show cumulative count of Article Views (full-text article views including HTML views, PDF and ePub downloads, according to the available data) and Abstracts Views on Vision4Press platform.
Data correspond to usage on the plateform after 2015. The current usage metrics is available 48-96 hours after online publication and is updated daily on week days.
Initial download of the metrics may take a while.