Fig. 5.
Download original image
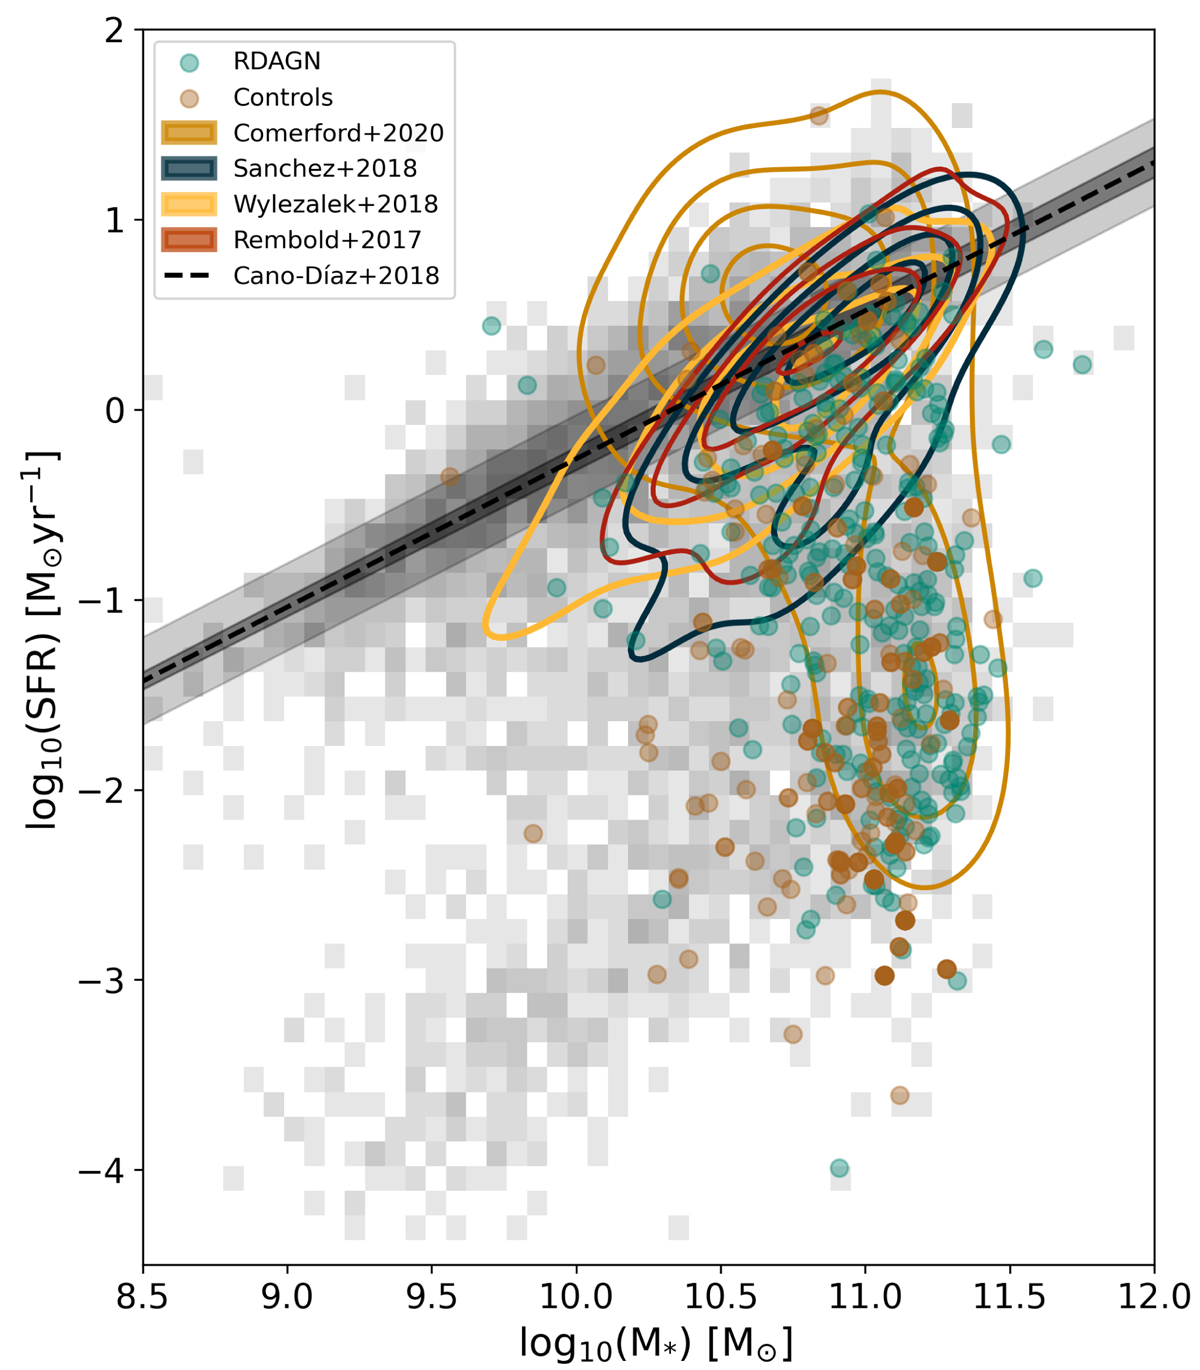
Relation between SFR and M* for existing MaNGA AGN catalogs. The gray-colored image represents the density of MaNGA galaxies in the plot. The RDAGN studied in this work are indicated in green. Dark yellow contours represent the density of AGN host galaxies for from the Comerford et al. (2020) AGN catalog, the dark blue contours represent the density of galaxies from the Sánchez et al. (2018) AGN catalog, the Wylezalek et al. (2018) AGN catalog are represented by orange contours, and the red contours exhibit the density of Rembold et al. (2017) AGN catalog. The SFR–M* space is divided into 50 × 50 bins, and the contours are drawn at 25, 50, 75, and 100% of the maximum number density. The dotted line represents the SFMS derived for SDSS-IV MaNGA galaxies derived by Cano-Díaz et al. (2019), the dark gray shading represents the errors on slope, and the light gray shading represents the standard deviation.
Current usage metrics show cumulative count of Article Views (full-text article views including HTML views, PDF and ePub downloads, according to the available data) and Abstracts Views on Vision4Press platform.
Data correspond to usage on the plateform after 2015. The current usage metrics is available 48-96 hours after online publication and is updated daily on week days.
Initial download of the metrics may take a while.