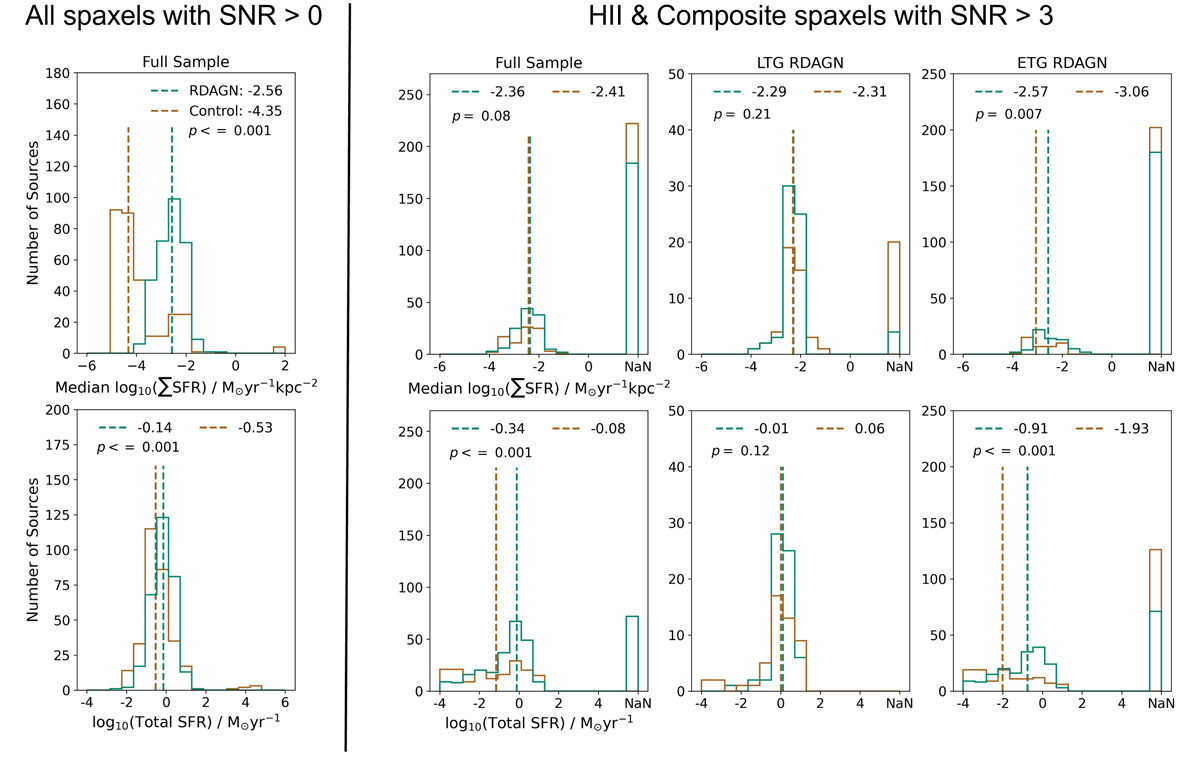
Fig. 11.
Download original image
Left of the black vertical line: distribution of the median ∑SFR (top panel) and for the total SFR (bottom panel) for RDAGN galaxies (green) and their controls (brown). We calculate these quantities using all spaxels with a S/N > 0 in all emission-lines used for classification. Right of the black vertical line from left to right: distribution of the median ∑SFR (top panel) and for the total SFR (bottom panel) for RDAGN galaxies (green) and their controls (brown) for the entire sample, LTGs, and ETGs. These quantities are derived from spaxels with a S/N > 3. When no spaxels in the galaxy meet the relevant criteria, the median or total SFR is set to “NaN”.
Current usage metrics show cumulative count of Article Views (full-text article views including HTML views, PDF and ePub downloads, according to the available data) and Abstracts Views on Vision4Press platform.
Data correspond to usage on the plateform after 2015. The current usage metrics is available 48-96 hours after online publication and is updated daily on week days.
Initial download of the metrics may take a while.