Fig. 1.
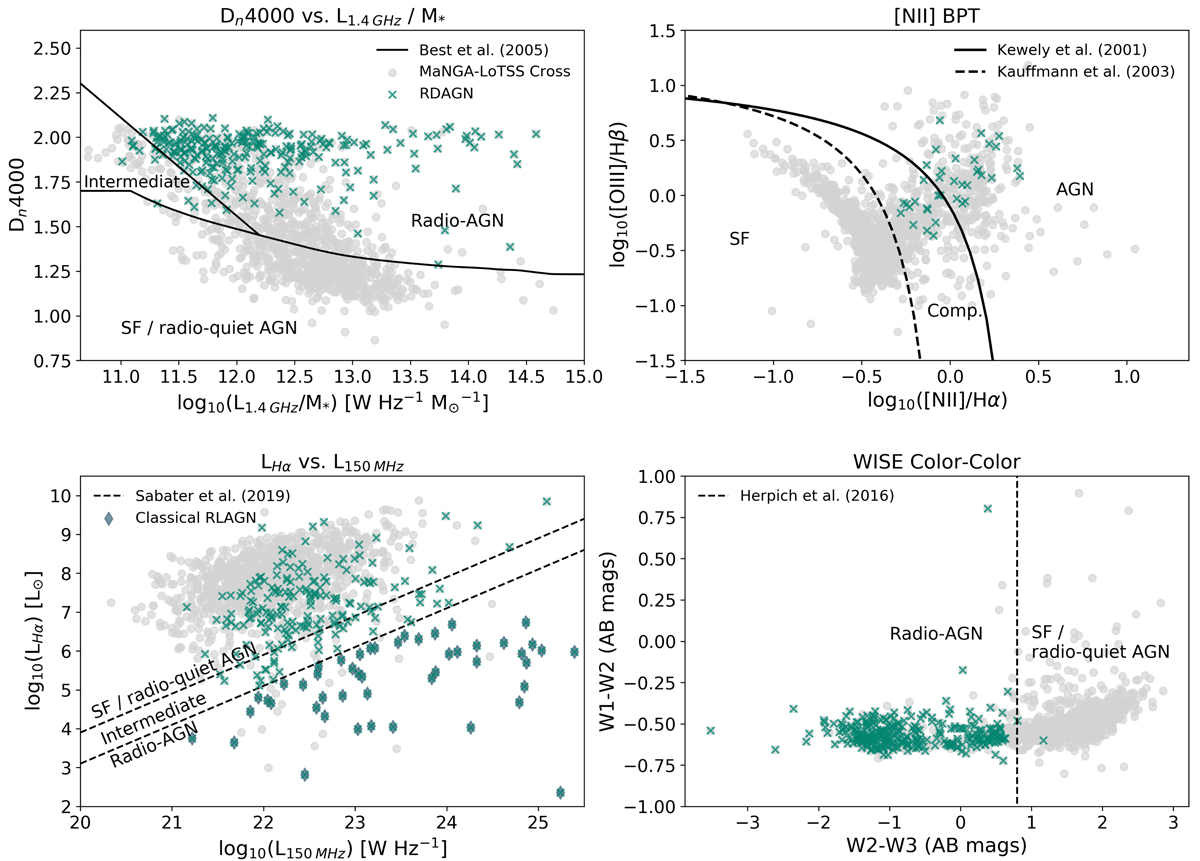
Download original image
Location of the RDAGN host galaxies on the four diagnostic diagrams used to separate galaxies whose radio emission was from SF from those galaxies likely powered by AGN. Top row from left to right: Dn4000 versus L1.4 GHz/M* from Best et al. (2005b), the [NII]/Hα BPT diagram (Baldwin et al. 1981). Bottom row from left to right: LHα versus L150 MHz, WISE W1 − W2 versus W2 − W3 color-color diagram. The lines in each diagram represent division between SF/radio-quiet AGN, intermediate, and radio AGN. The final RDAGN sample, obtained following our criteria described in Sect. 2, is indicated by green “x’s”. The gray circles represent the full sample of MaNGA-LoTSS galaxies. Classical RLAGN are represented on the LHα versus L150 MHz diagram with dark gray diamonds.
Current usage metrics show cumulative count of Article Views (full-text article views including HTML views, PDF and ePub downloads, according to the available data) and Abstracts Views on Vision4Press platform.
Data correspond to usage on the plateform after 2015. The current usage metrics is available 48-96 hours after online publication and is updated daily on week days.
Initial download of the metrics may take a while.