Open Access
Fig. A.2.
Download original image
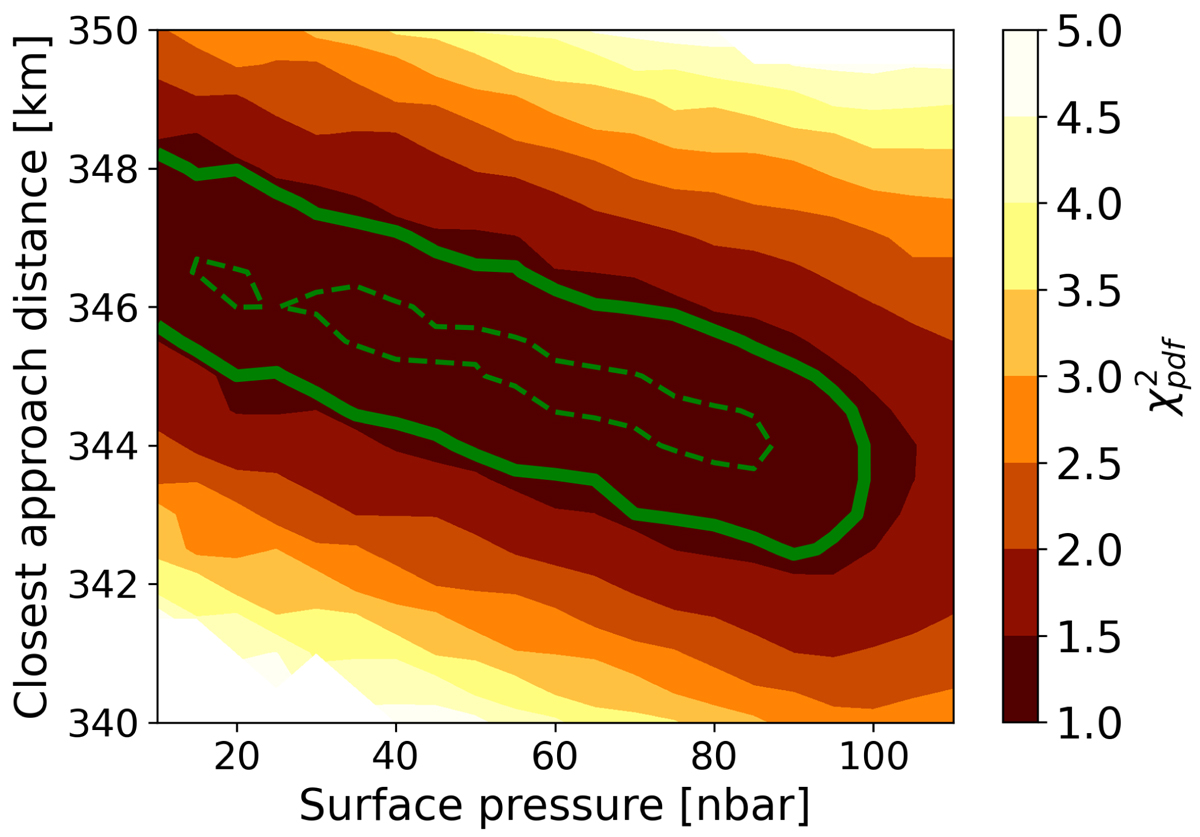
Chi-squared per degree of freedom (χpdf2) map vs. surface pressure and CA distance. The inner dashed (resp. outer solid) green level curve is the 1σ (resp. 3σ) domain.
Current usage metrics show cumulative count of Article Views (full-text article views including HTML views, PDF and ePub downloads, according to the available data) and Abstracts Views on Vision4Press platform.
Data correspond to usage on the plateform after 2015. The current usage metrics is available 48-96 hours after online publication and is updated daily on week days.
Initial download of the metrics may take a while.