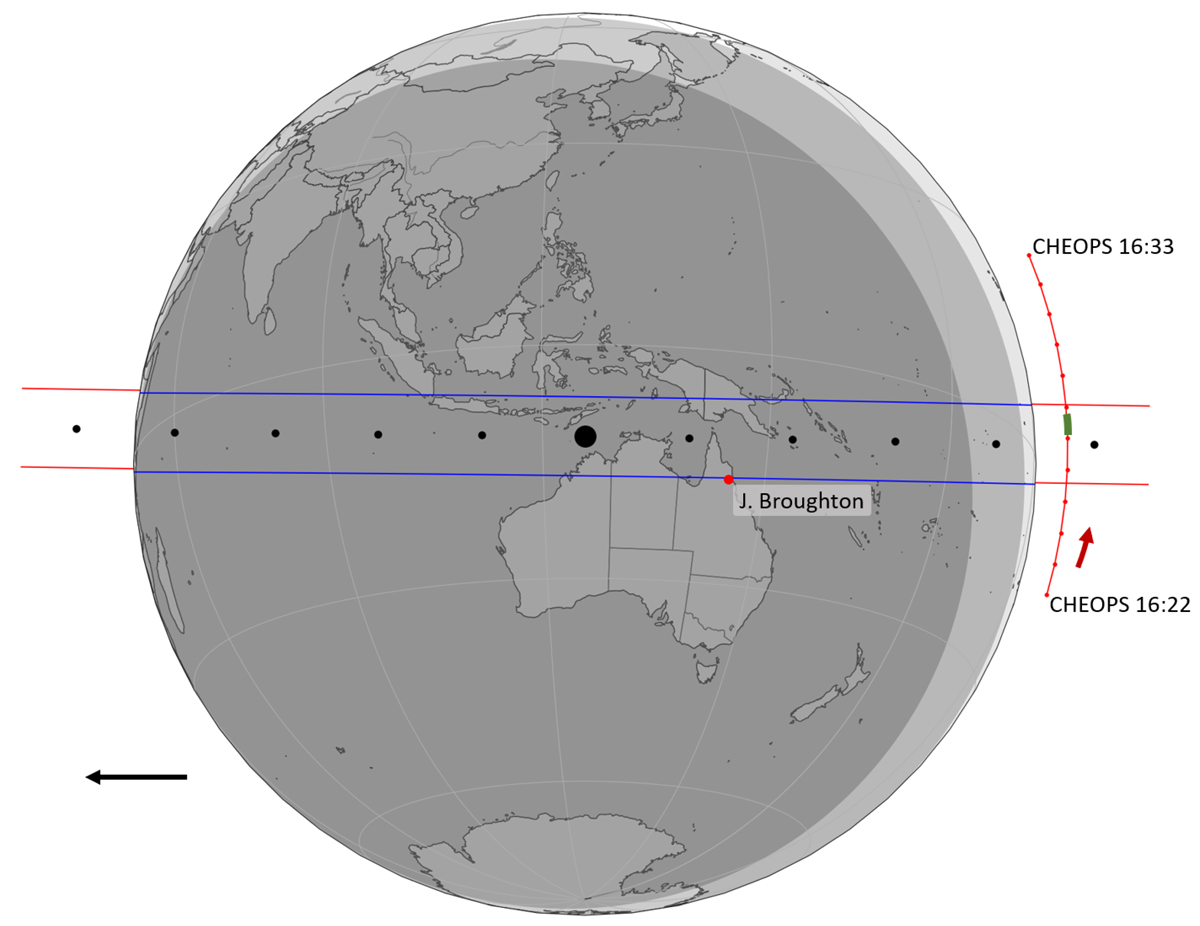
Fig. 1.
Download original image
Prediction map of the Quaoar event on 2020 June 11, the black arrow on the lower left corner shows the direction of the shadow’s movement. The blue lines stand for the shadow limits, and the black dots are the centre of the shadow, separated by one minute, with the biggest one representing the geocentric closest approach time. The red dot on the map represents the position of the ground-based observer who participated in this campaign. The red line on the right side of the map shows the projected position of CHEOPS from 16:22 to 16:33 UTC, two consecutive red dots are separated by one minute in time, and the red arrow emphasises the direction of motion. The green line shows when and where CHEOPS obtained the positive chord.
Current usage metrics show cumulative count of Article Views (full-text article views including HTML views, PDF and ePub downloads, according to the available data) and Abstracts Views on Vision4Press platform.
Data correspond to usage on the plateform after 2015. The current usage metrics is available 48-96 hours after online publication and is updated daily on week days.
Initial download of the metrics may take a while.