Fig. 8.
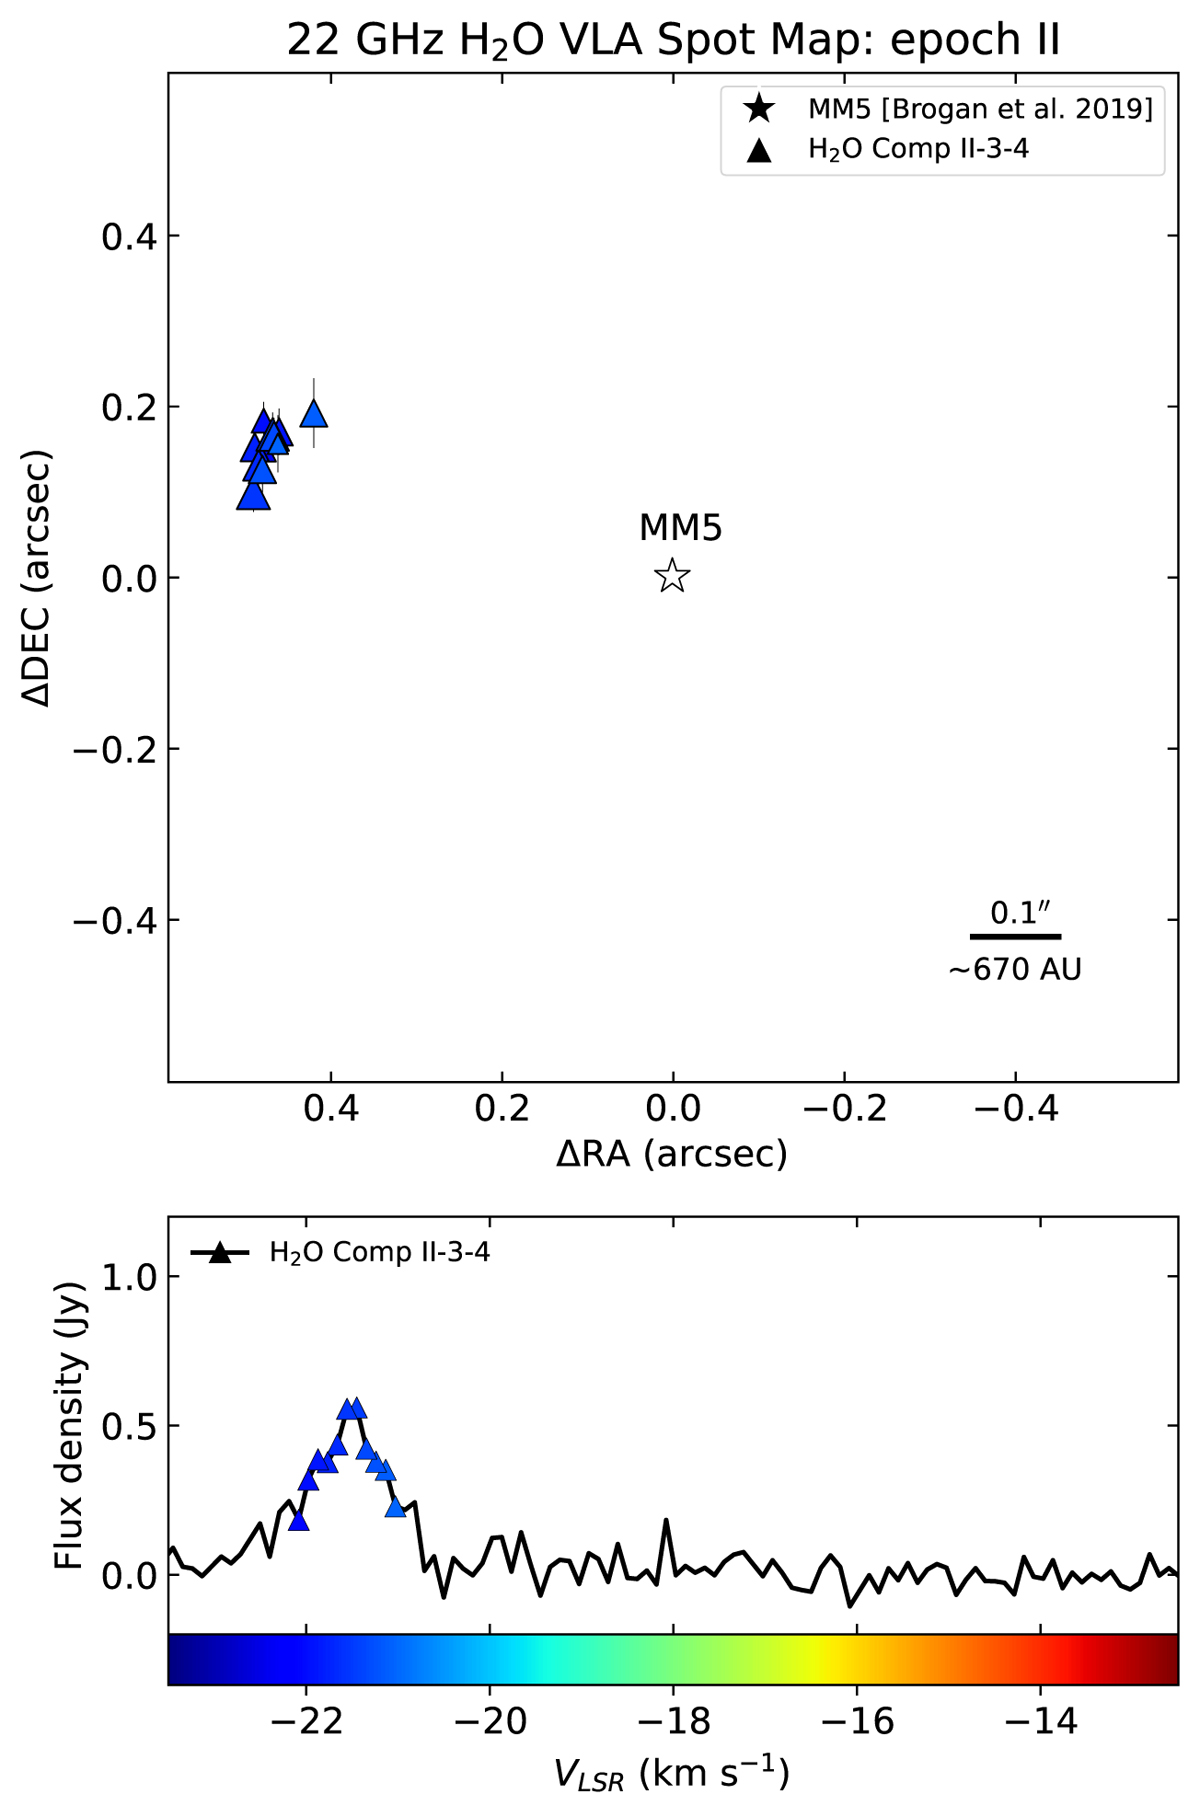
Download original image
22 GHz water maser spot map and spectrum of component II-3-4 from epoch II. The plot is colour-coded by radial velocity (see the colour bar for the colour scale). The markers on the spectrum correspond to the maser spots on the map. The diameter of each spot is proportional to the flux. The positional offsets are relative to the MM5 position (star marker) from Brogan et al. (2019).
Current usage metrics show cumulative count of Article Views (full-text article views including HTML views, PDF and ePub downloads, according to the available data) and Abstracts Views on Vision4Press platform.
Data correspond to usage on the plateform after 2015. The current usage metrics is available 48-96 hours after online publication and is updated daily on week days.
Initial download of the metrics may take a while.