Fig. 4.
Download original image
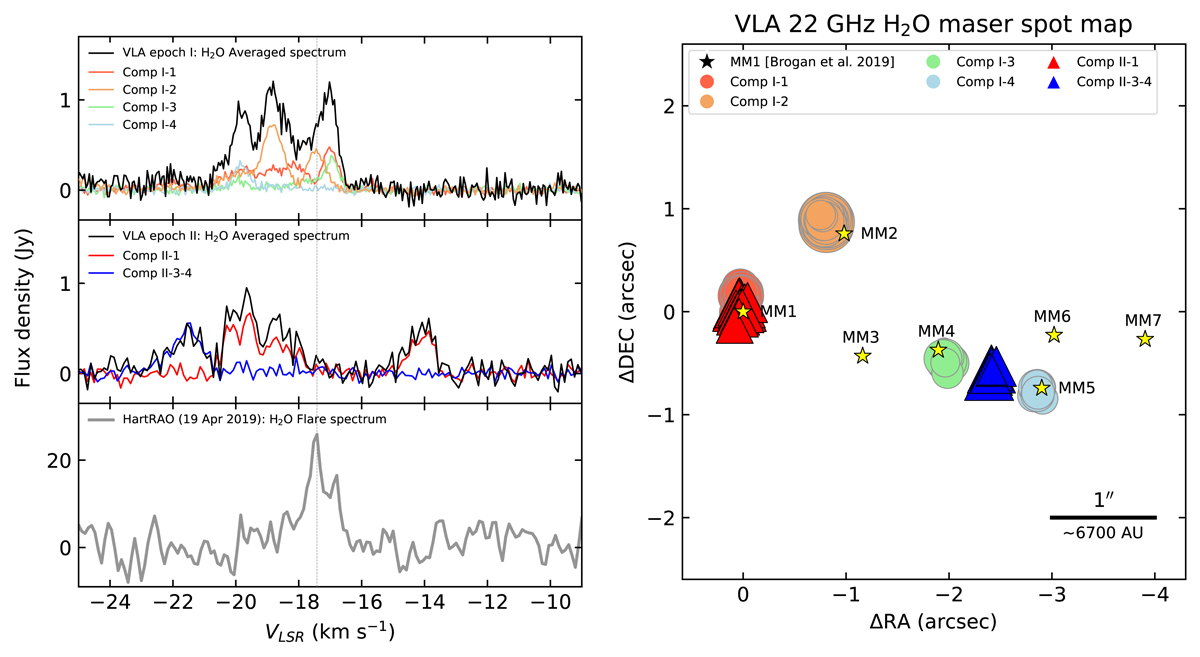
Comparison of the 22 GHz H2O maser emission detected with the VLA during epochs I and II. Left panels: spectra of the H2O maser components (marked by colour; see the legend) and total spectrum (black line) detected with the VLA during epoch I (top) and epoch II (middle). Bottom panel: maser flare spectrum obtained with the HartRAO 26 m telescope on April 19, 2019. The dashed line indicates the peak velocity of the flare spectrum. Right panel: combined H2O maser spot map. The epoch I maser spots are marked by light-coloured circles; the epoch II maser spots are marked by bright-coloured triangles. Positional offsets are relative to MM1 (Brogan et al. 2019). The position of the continuum emission detected with the VLA and associated with MM3 (Brogan et al. 2019) is marked by a black cross.
Current usage metrics show cumulative count of Article Views (full-text article views including HTML views, PDF and ePub downloads, according to the available data) and Abstracts Views on Vision4Press platform.
Data correspond to usage on the plateform after 2015. The current usage metrics is available 48-96 hours after online publication and is updated daily on week days.
Initial download of the metrics may take a while.