Fig. 2.
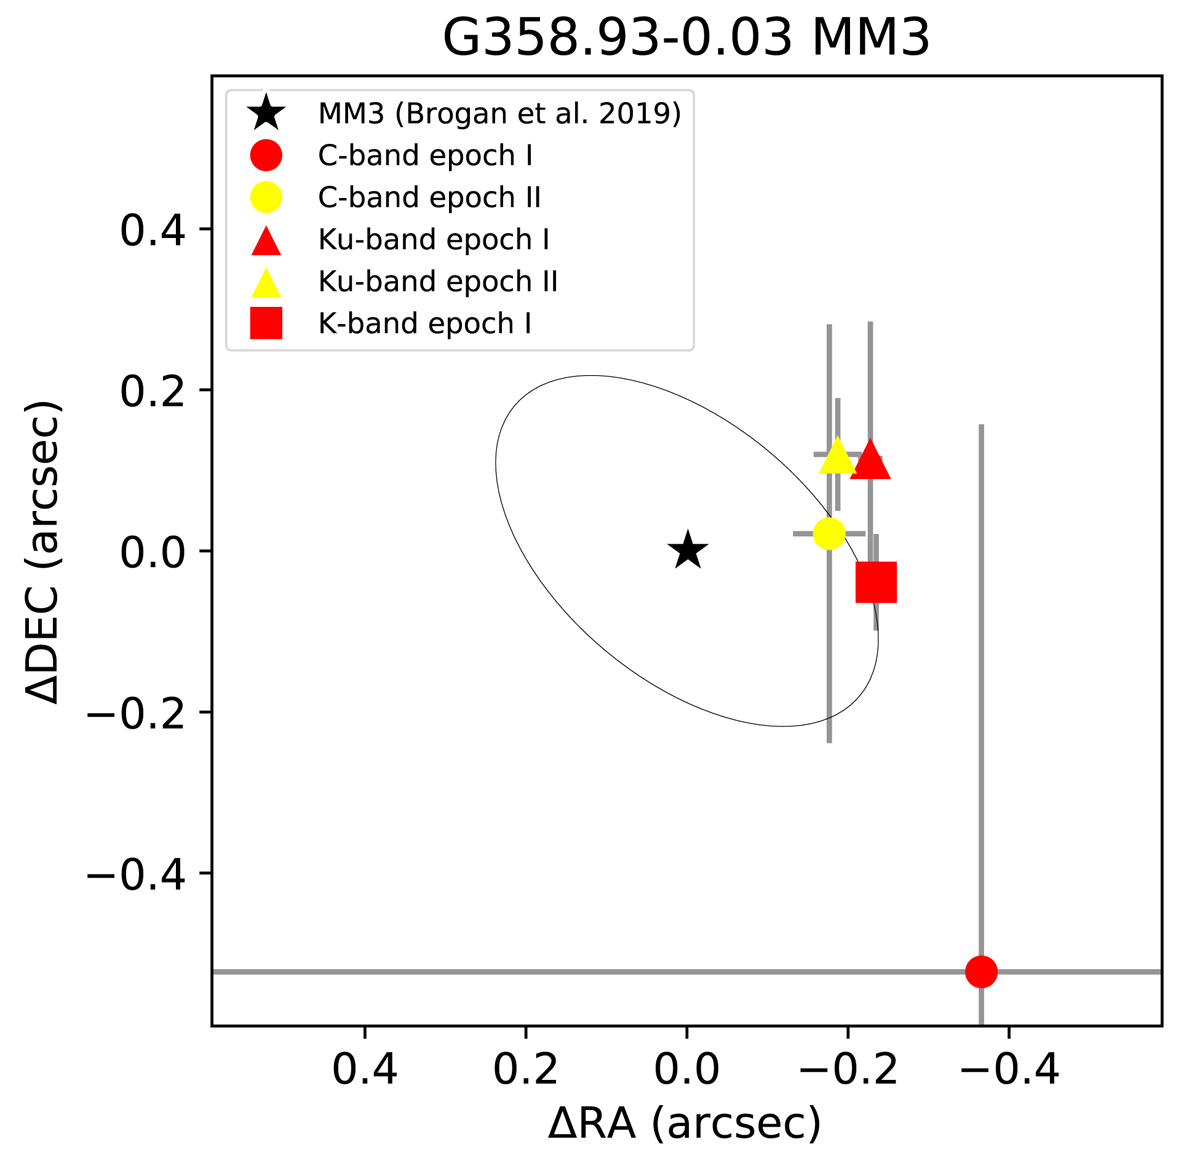
Download original image
Centimetre-continuum (this work) and millimetre-continuum (Brogan et al. 2019) peak position of MM3. The C- (circle), Ku- (triangle), and K-band (square) peaks detected with the VLA during epoch I are shown in red, and during epoch II in yellow. The ellipse represents the size estimation of MM3 obtained in Brogan et al. (2019). The grey error bars indicate the position fitting errors from Table 3.
Current usage metrics show cumulative count of Article Views (full-text article views including HTML views, PDF and ePub downloads, according to the available data) and Abstracts Views on Vision4Press platform.
Data correspond to usage on the plateform after 2015. The current usage metrics is available 48-96 hours after online publication and is updated daily on week days.
Initial download of the metrics may take a while.