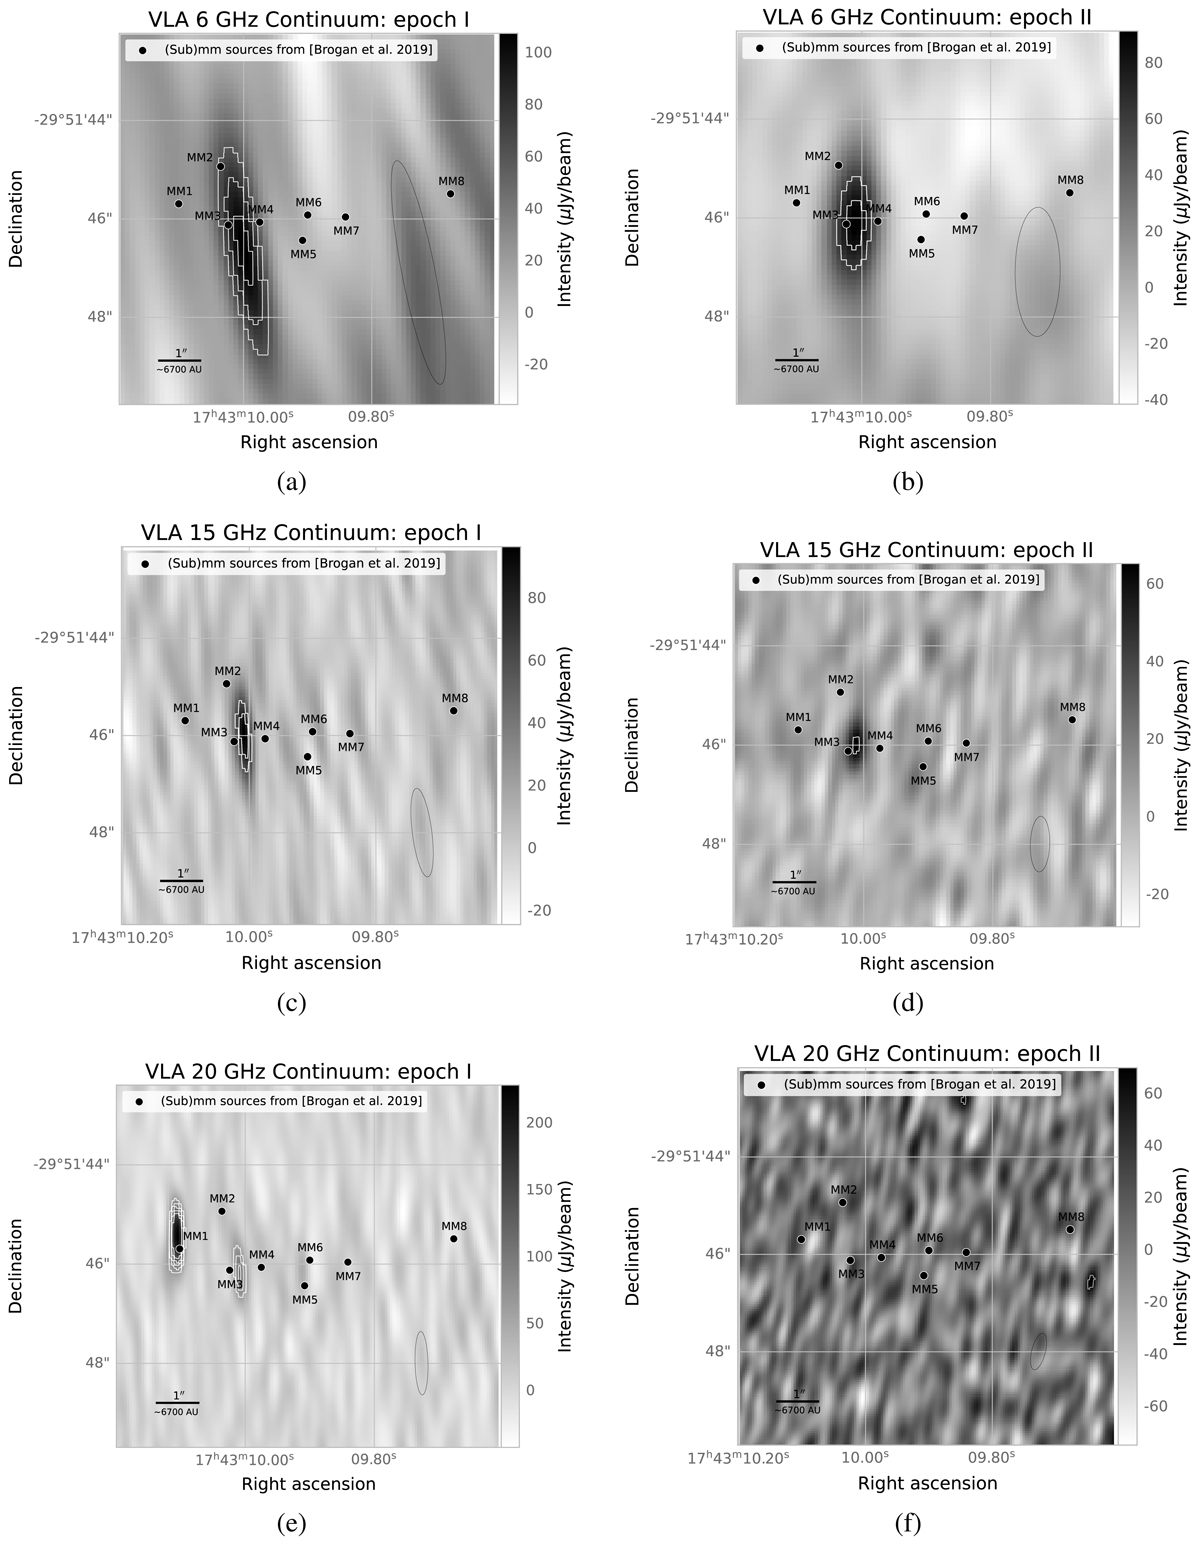
Fig. 1.
Download original image
VLA continuum images of G358.93−0.03 at 6, 15, and 20 GHz during epochs I (left panels) and II (right panels). The contour levels are [6, 8, 10] × 10 μJy beam−1. The black dots mark the positions of the (sub-)millimetre sources from Brogan et al. (2019). The synthesized VLA beam size of each image is shown with the black ellipses in the lower-right corner of the panels.
Current usage metrics show cumulative count of Article Views (full-text article views including HTML views, PDF and ePub downloads, according to the available data) and Abstracts Views on Vision4Press platform.
Data correspond to usage on the plateform after 2015. The current usage metrics is available 48-96 hours after online publication and is updated daily on week days.
Initial download of the metrics may take a while.