Fig. 7.
Download original image
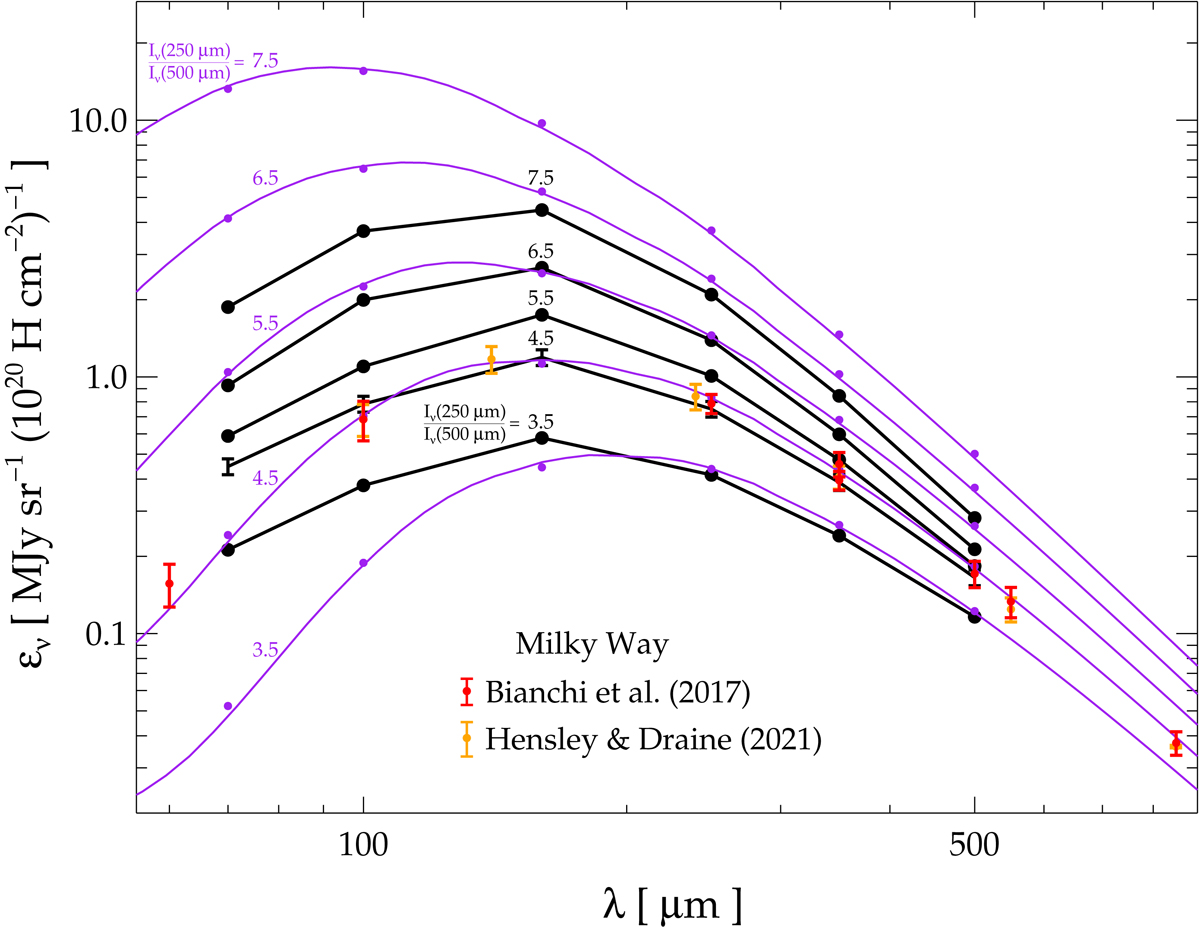
Average emissivity SED for the five Iν(250 μm)/Iν(500 μm) bins of Fig. 3, using ![]() (black lines). For Iν(250 μm)/Iν(500 μm)=4.5, the calibration errors are shown. Purple lines show the SED from the THEMIS model, averaged over the Iν(250 μm)/Iν(500 μm) values in each bin. Purple dots mark the emissivities after averaging over the Herschel filter response functions. The MW emissivities are also shown.
(black lines). For Iν(250 μm)/Iν(500 μm)=4.5, the calibration errors are shown. Purple lines show the SED from the THEMIS model, averaged over the Iν(250 μm)/Iν(500 μm) values in each bin. Purple dots mark the emissivities after averaging over the Herschel filter response functions. The MW emissivities are also shown.
Current usage metrics show cumulative count of Article Views (full-text article views including HTML views, PDF and ePub downloads, according to the available data) and Abstracts Views on Vision4Press platform.
Data correspond to usage on the plateform after 2015. The current usage metrics is available 48-96 hours after online publication and is updated daily on week days.
Initial download of the metrics may take a while.