Fig. 5.

Download original image
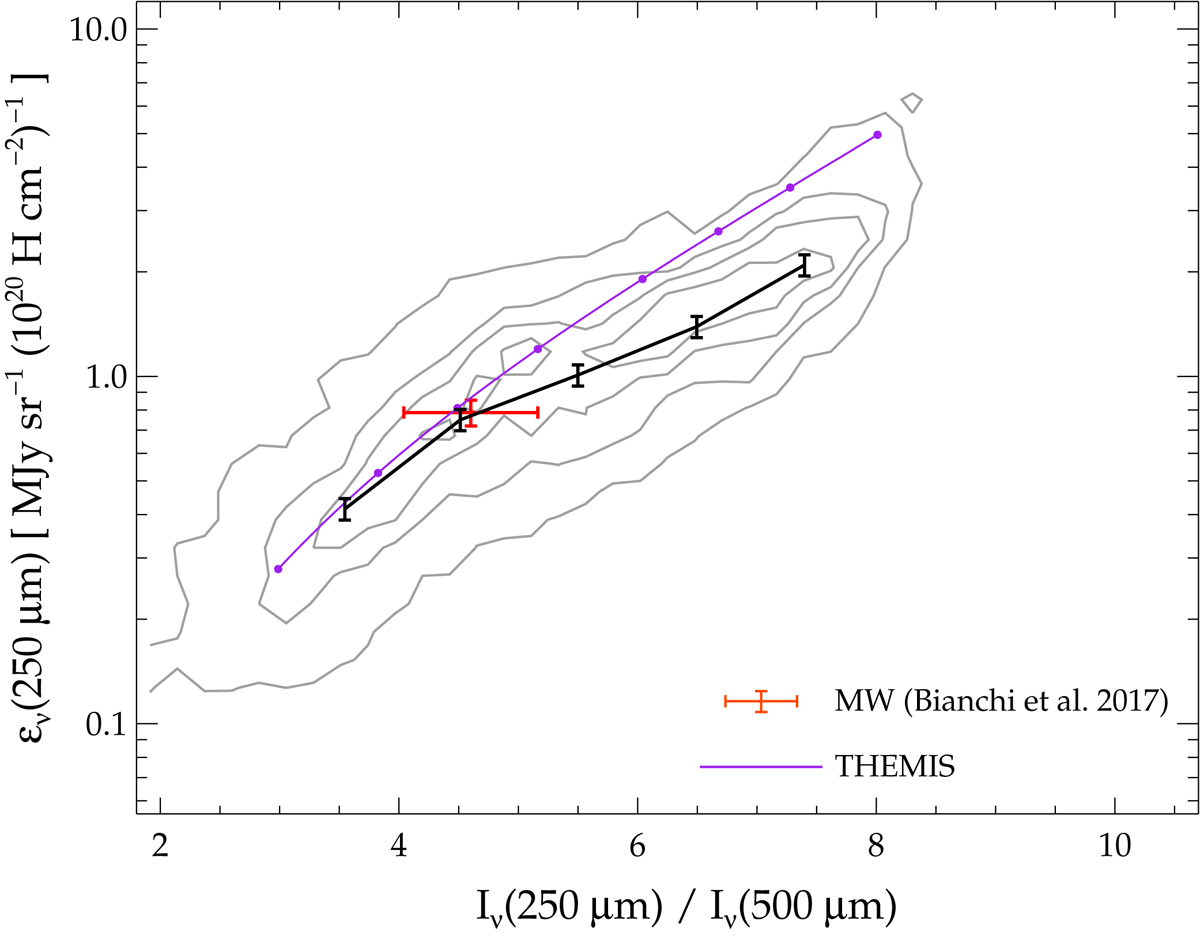
ϵν(250 μm) versus Iν(250 μm)/Iν(500 μm). Comparison between our results and the MW value for the cirrus. We also show the behavior of the THEMIS dust model under ISRFs of growing intensities (dots are for U = 0.2, 0.5, 1, 2, 5, 10, 20, and 50 from left to right, with ISRF = U × LISRF; see Appendix B). Grey contours and average emissivity as in Fig. 3. The errorbars for the average emissivity show the impact on ϵν(250 μm) of the SPIRE calibration error.
Current usage metrics show cumulative count of Article Views (full-text article views including HTML views, PDF and ePub downloads, according to the available data) and Abstracts Views on Vision4Press platform.
Data correspond to usage on the plateform after 2015. The current usage metrics is available 48-96 hours after online publication and is updated daily on week days.
Initial download of the metrics may take a while.


