Fig. 3.
Download original image
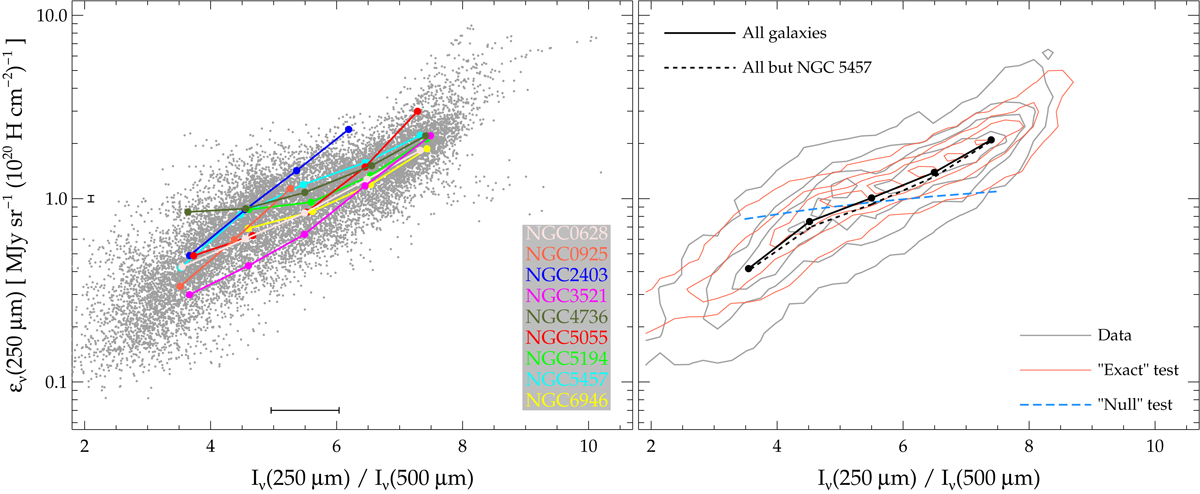
Emissivity at 250 μm, ϵν(250 μm) versus the Iν(250 μm)/Iν(500 μm) ratio (assuming ![]() ). In the left panel, individual pixels are shown; in the right panel, gray contours encompass 95, 75, 50, and 25% of the sample. The mean ϵν(250 μm) obtained after averaging pixels over five bins in the range of 3 ≤ Iν(250 μm)/Iν(500 μm)< 8 is also shown: in the left panel, for each galaxy separately; in the right panel, for the total sample (and the total sample but NGC 5457). The left panel further shows the average errorbars for the central Iν(250 μm)/Iν(500 μm) bin; the right panel, the expectation for the “exact” (red contours) and “null” (blue binned averages) hypotheses.
). In the left panel, individual pixels are shown; in the right panel, gray contours encompass 95, 75, 50, and 25% of the sample. The mean ϵν(250 μm) obtained after averaging pixels over five bins in the range of 3 ≤ Iν(250 μm)/Iν(500 μm)< 8 is also shown: in the left panel, for each galaxy separately; in the right panel, for the total sample (and the total sample but NGC 5457). The left panel further shows the average errorbars for the central Iν(250 μm)/Iν(500 μm) bin; the right panel, the expectation for the “exact” (red contours) and “null” (blue binned averages) hypotheses.
Current usage metrics show cumulative count of Article Views (full-text article views including HTML views, PDF and ePub downloads, according to the available data) and Abstracts Views on Vision4Press platform.
Data correspond to usage on the plateform after 2015. The current usage metrics is available 48-96 hours after online publication and is updated daily on week days.
Initial download of the metrics may take a while.