Fig. 1.
Download original image
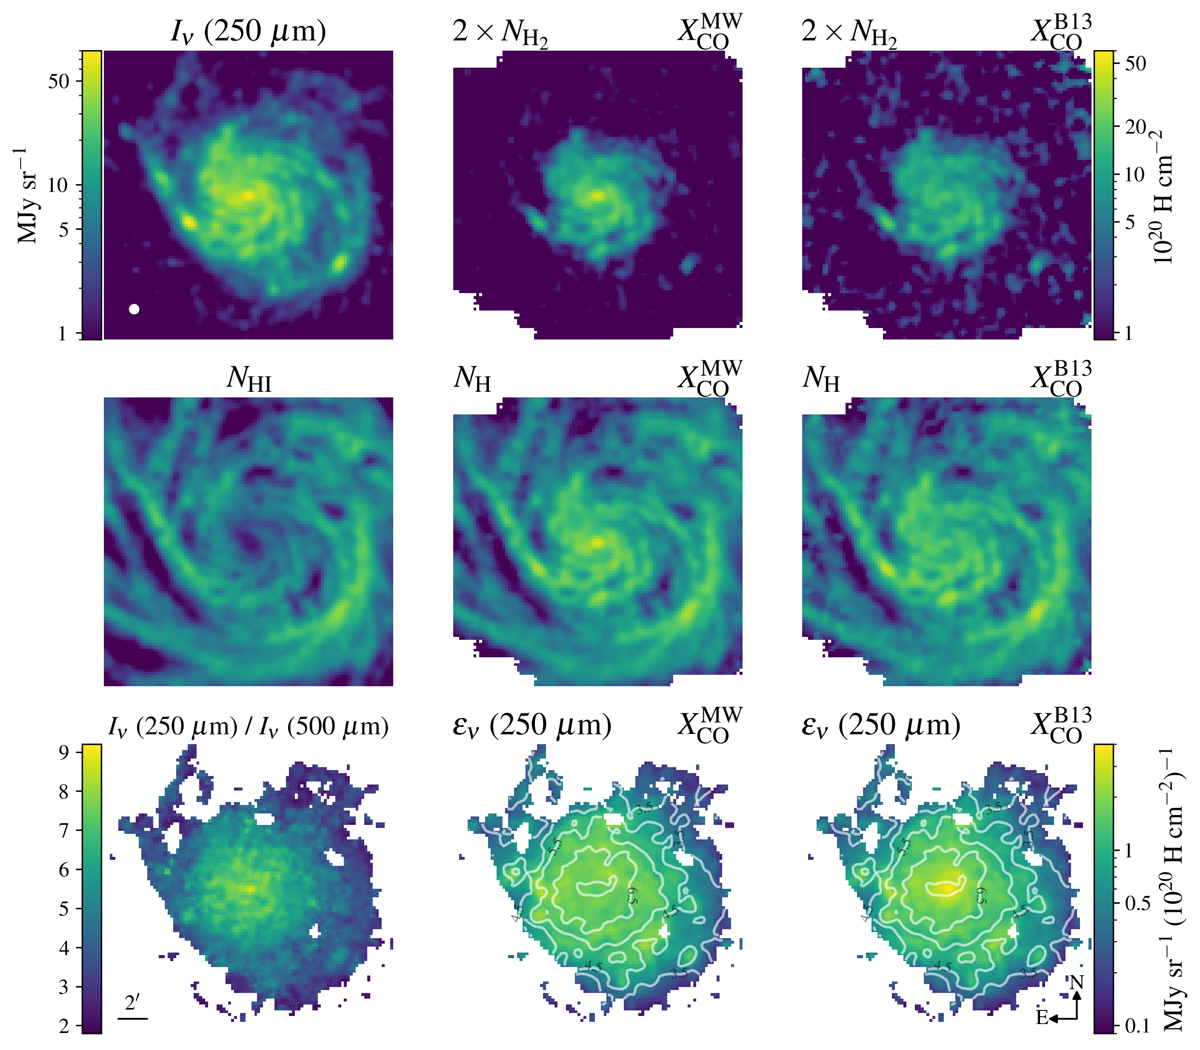
Dataset and results for NGC 5457. The top row shows the 250 μm image, the molecular gas column density derived from CO observations for ![]() , the same for
, the same for ![]() ; the central row shows the atomic gas column density NH I, and the total column density NH for the two choices of XCO; the bottom rowIν(250 μm)/Iν(500 μm), and ϵν(250 μm) for the two XCO. Maps of gas column densities have the same scale (top-right color bar), as well as the two ϵν(250 μm) maps (bottom-right color bar). Contours on the ϵν(250 μm) maps show the central value of the Iν(250 μm)/Iν(500 μm) bins used in the analysis. All images are convolved to FWHM ≈ 36″ (white circle in the top-left panel).
; the central row shows the atomic gas column density NH I, and the total column density NH for the two choices of XCO; the bottom rowIν(250 μm)/Iν(500 μm), and ϵν(250 μm) for the two XCO. Maps of gas column densities have the same scale (top-right color bar), as well as the two ϵν(250 μm) maps (bottom-right color bar). Contours on the ϵν(250 μm) maps show the central value of the Iν(250 μm)/Iν(500 μm) bins used in the analysis. All images are convolved to FWHM ≈ 36″ (white circle in the top-left panel).
Current usage metrics show cumulative count of Article Views (full-text article views including HTML views, PDF and ePub downloads, according to the available data) and Abstracts Views on Vision4Press platform.
Data correspond to usage on the plateform after 2015. The current usage metrics is available 48-96 hours after online publication and is updated daily on week days.
Initial download of the metrics may take a while.