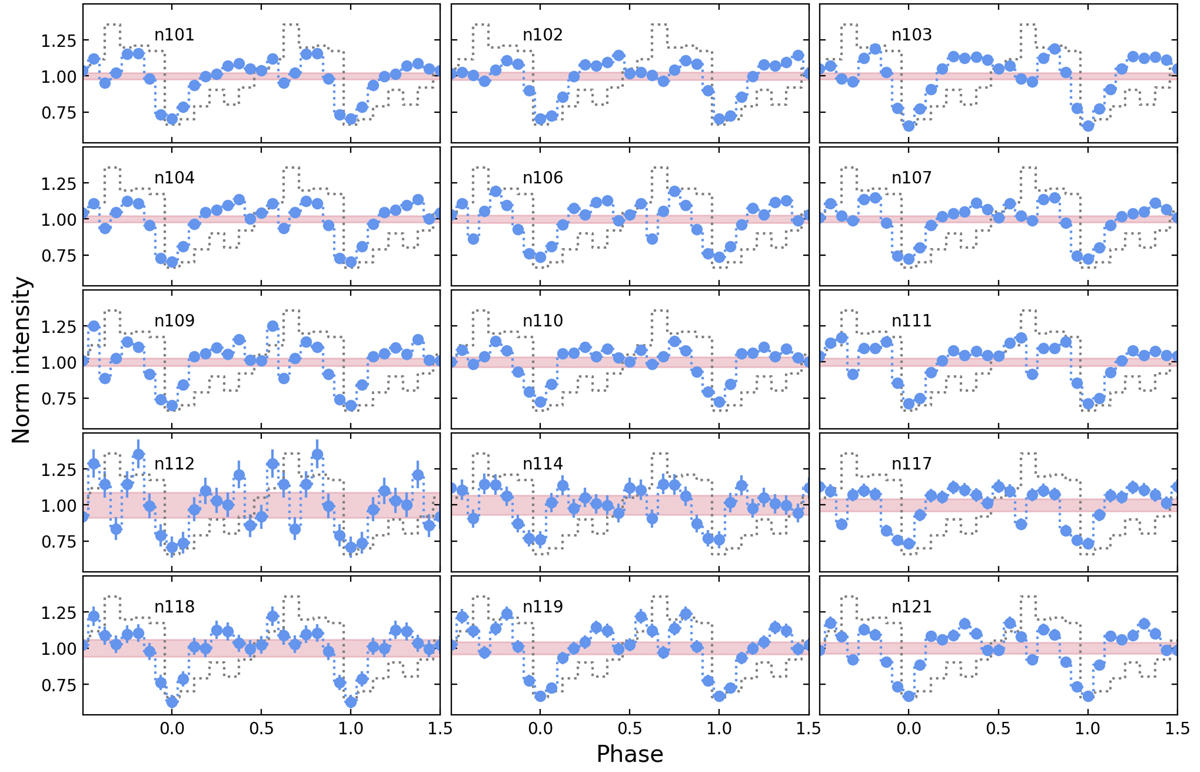
Fig. A.1.
Download original image
Pulse profiles (0.5–8.0 keV) of all NICER observations where significant pulsations were detectable. The labels within each panel denote the last three digits of the NICER obsid number, i.e. 4202430XXX. All profiles are normalised to the average intensity, and the minimum is shifted to zero phase. Shaded horizontal regions denote the limit of the statistically significant variability above the constant level hypothesis. For comparison, the 2016 pulse profile as measured by Chandra is plotted with a dotted grey line in each panel.
Current usage metrics show cumulative count of Article Views (full-text article views including HTML views, PDF and ePub downloads, according to the available data) and Abstracts Views on Vision4Press platform.
Data correspond to usage on the plateform after 2015. The current usage metrics is available 48-96 hours after online publication and is updated daily on week days.
Initial download of the metrics may take a while.